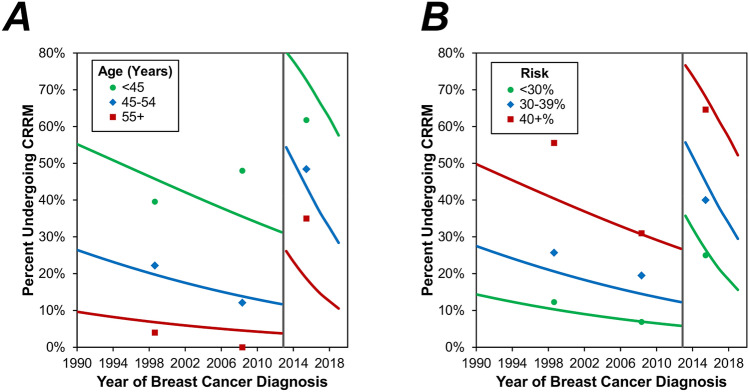
Figure 2.
Multivariable analysis of CRRM by age and estimated lifetime risk. Points represent the observed rate of CRRM in three periods (1990–2004, 2005-AJ, AJ-2019), and are plotted at the midpoint of the interval. Trend lines represent the multivariable model reported in Table 4, which was evaluated within each of the age and estimated lifetime risk categories, respectively. These trend lines are for the “average” patient; hence (A) is evaluated based on the distribution of risk categories from Table 1, and (B) based on an age of 47.8 years. The grey line indicates the timing of the AJ announcement.

