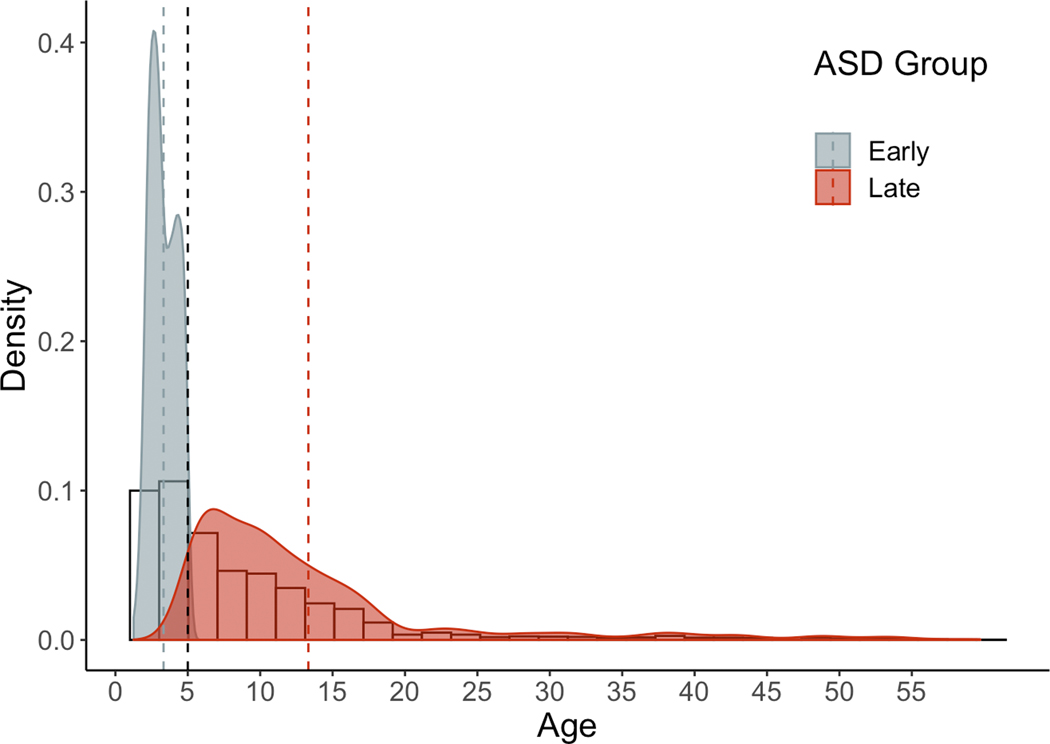
Figure 5. Histogram depicting age at first ASD diagnostic code.
Dashed black line represents split at age of first diagnosis, before and after age 5. Histogram represents age at ASD diagnosis for total cohort (n=2935). Density plots indicate age at ASD first encounter by early and late group; dashed lines designate mean age at diagnosis for each group.

