Fig. 3.

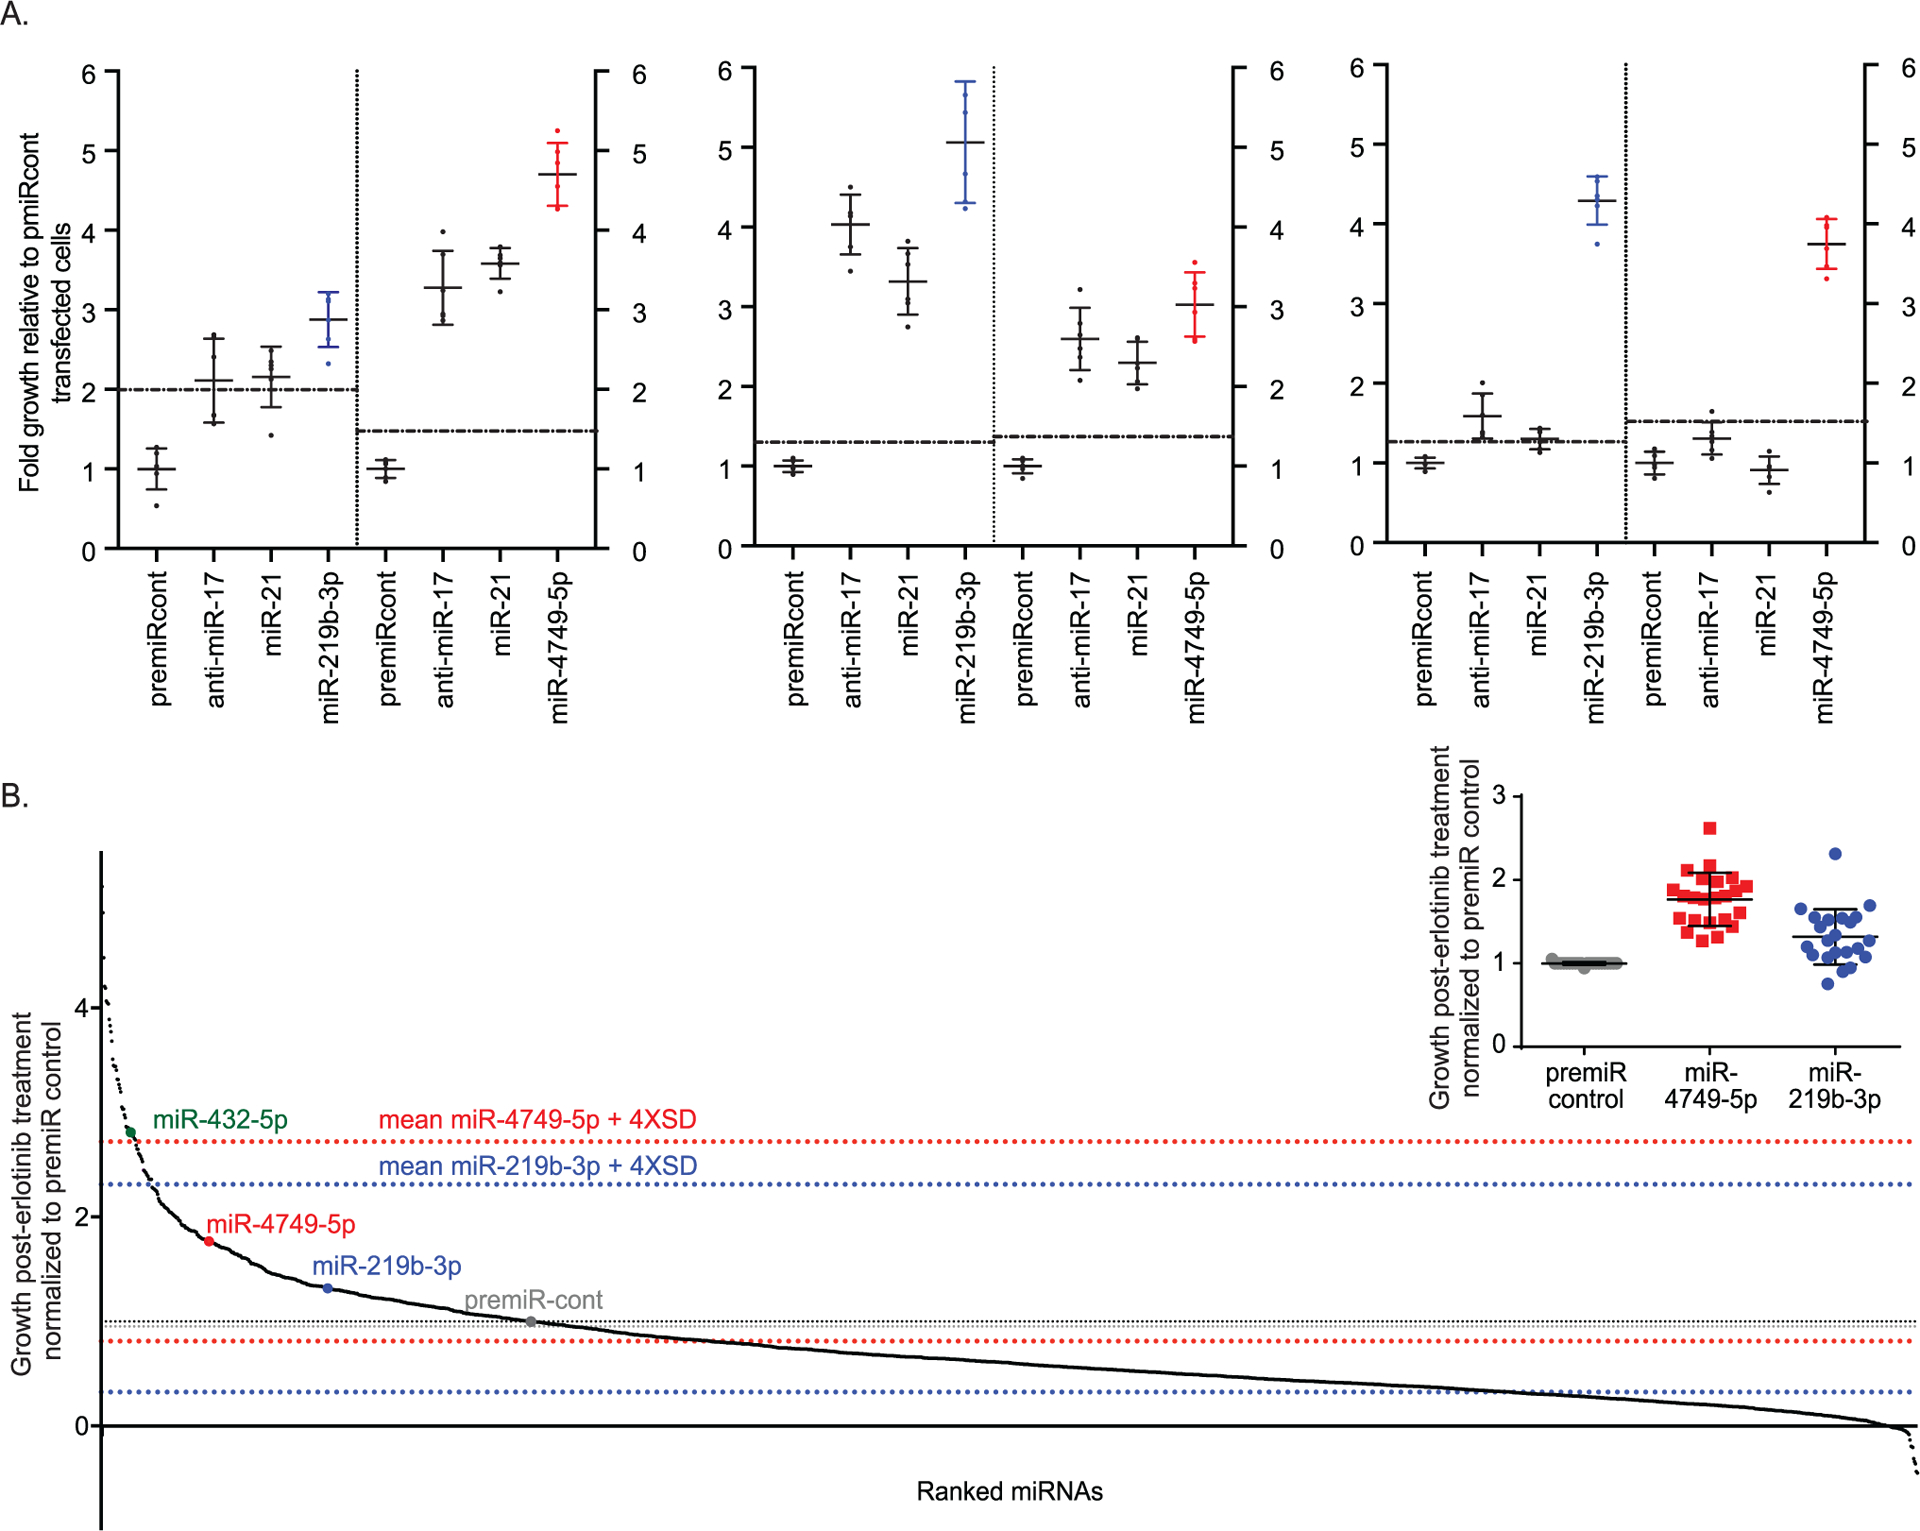
Overexpression of miRNAs alters the response of cells to erlotinib. A) Selection of positive controls for miRNA overexpression screen. EKVX-pmiR cells were transfected with 6 nM premiRcontrol, anti-miR-17, miR-21, or miRNAs from mirVana library (plate ID: Hs Mimic v19-A4–4). At the same time, all wells were transfected with 0.6 nM siLUC2 for normalization. Twenty-four hours post-transfection, cells were exposed to 75% growth inhibitory (GI75) concentration of erlotinib. Seventy-two hours post-treatment, reporter activities were measured. Following normalization for transfection, the growth of erlotinib treated, miRNA transfected cells was represented relative to that of negative control transfected cells. The means plus four-times the standard deviation of the negative control are depicted with a dotted line. Three individual replicates are shown. Right and left side of each graph include data obtained from two separate plates. Respective controls are included in each plate and the mean indicated. For clarity, only miR-219b (blue) and miR-4749–5p (red) from the library are shown. B) EKVX-pmiR cells were co-transfected with 6 nM premiRcont, miRNAs from the mirVana library, or positive controls, and 0.6 nM siLUC2. Twenty-four hours post-transfection, cells were exposed to the GI75 concentration of erlotinib. Seventy-two hours post-treatment, reporter activity was measured. Fold growth of transfected cells in the presence of erlotinib is represented relative to cells transfected with the negative control (premiRcont), in ranked order on the x-axis. Grey dotted lines represent the mean plus and minus four-times the standard deviation of the negative control, while red and blue dotted lines represent the mean plus and minus four-times the standard deviation for miR-4749 and miR-219b-3p, respectively. Inset graph depicts fold growth of cells transfected with premiRcontrol or positive controls (miR-4749 and miR-219b-3p) in the presence of erlotinib from all 23 plates used for the screen.
