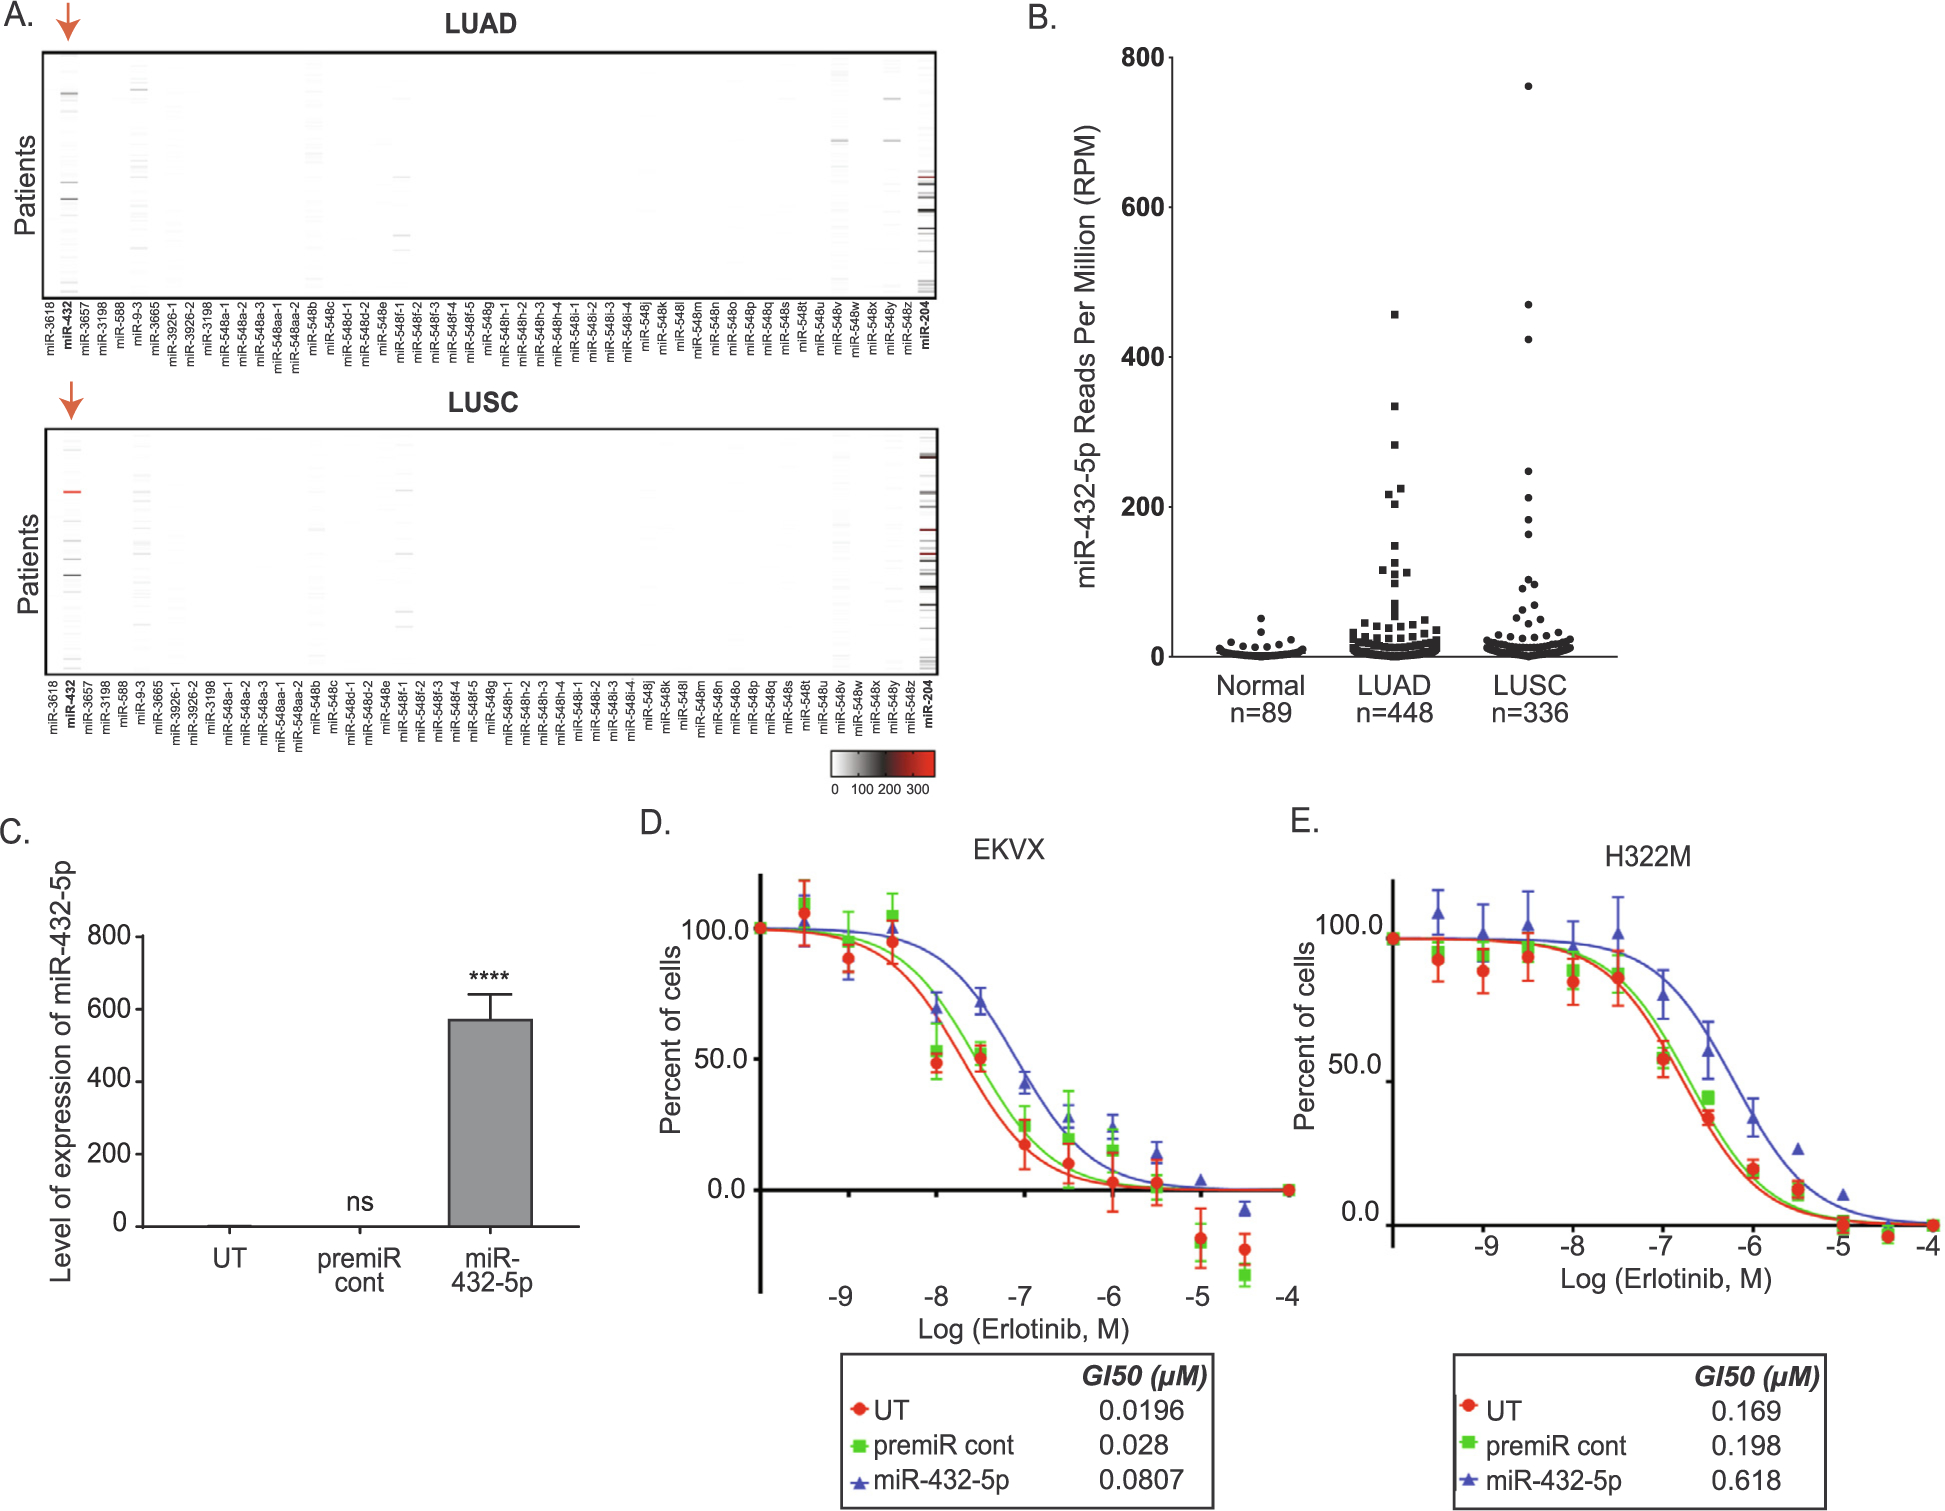
Fig. 5.

miR-432 is high in NCSLC tumors and promotes erlotinib resistance in NSCLC sensitive cell lines. A) Expression of top 60 miRNAs in patient samples. Patient miRNA sequenced data from LUAD and LUSC were retrieved from TCGA. The Reads Per Million (RPM) miRNA mapped were graphed using GraphPad prism version 8 software to visualize the reads for each miRNA in each patient. The red arrow represents miR-432–5p expression in LUAD and LUSC patients. The scale bars represent the read counts from undetected or zero (white), to moderately elevated (grey), or high (red). B) Quantification of miR-432–5p levels in EKVX-pmiR cells post-transfection of miR-432–5p. One-way ANOVA analysis was used to calculate statistical significance. C) EKVX-pmiR cells or D) H322M-pmiR cells were untransfected (UT) or were reverse transfected with 6 nM premiRcont or miR-432–5p. Cells were exposed to varying concentrations of erlotinib or the highest equivalent volume of DMSO (negative control) containing media for 72 h. Erlotinib dose response was conducted using the SRB assay. For percent of cells calculation, the absorbance obtained from the cells at the time of addition of erlotinib or DMSO (i.e. time zero or tz) was first corrected for, followed by normalization of absorbance to the respective corrected DMSO values. GI50 erlotinib was calculated from the respective dose curves (as per the NCI-60 Cell Five-Dose Screen, NCI-60, DTP) [51].
