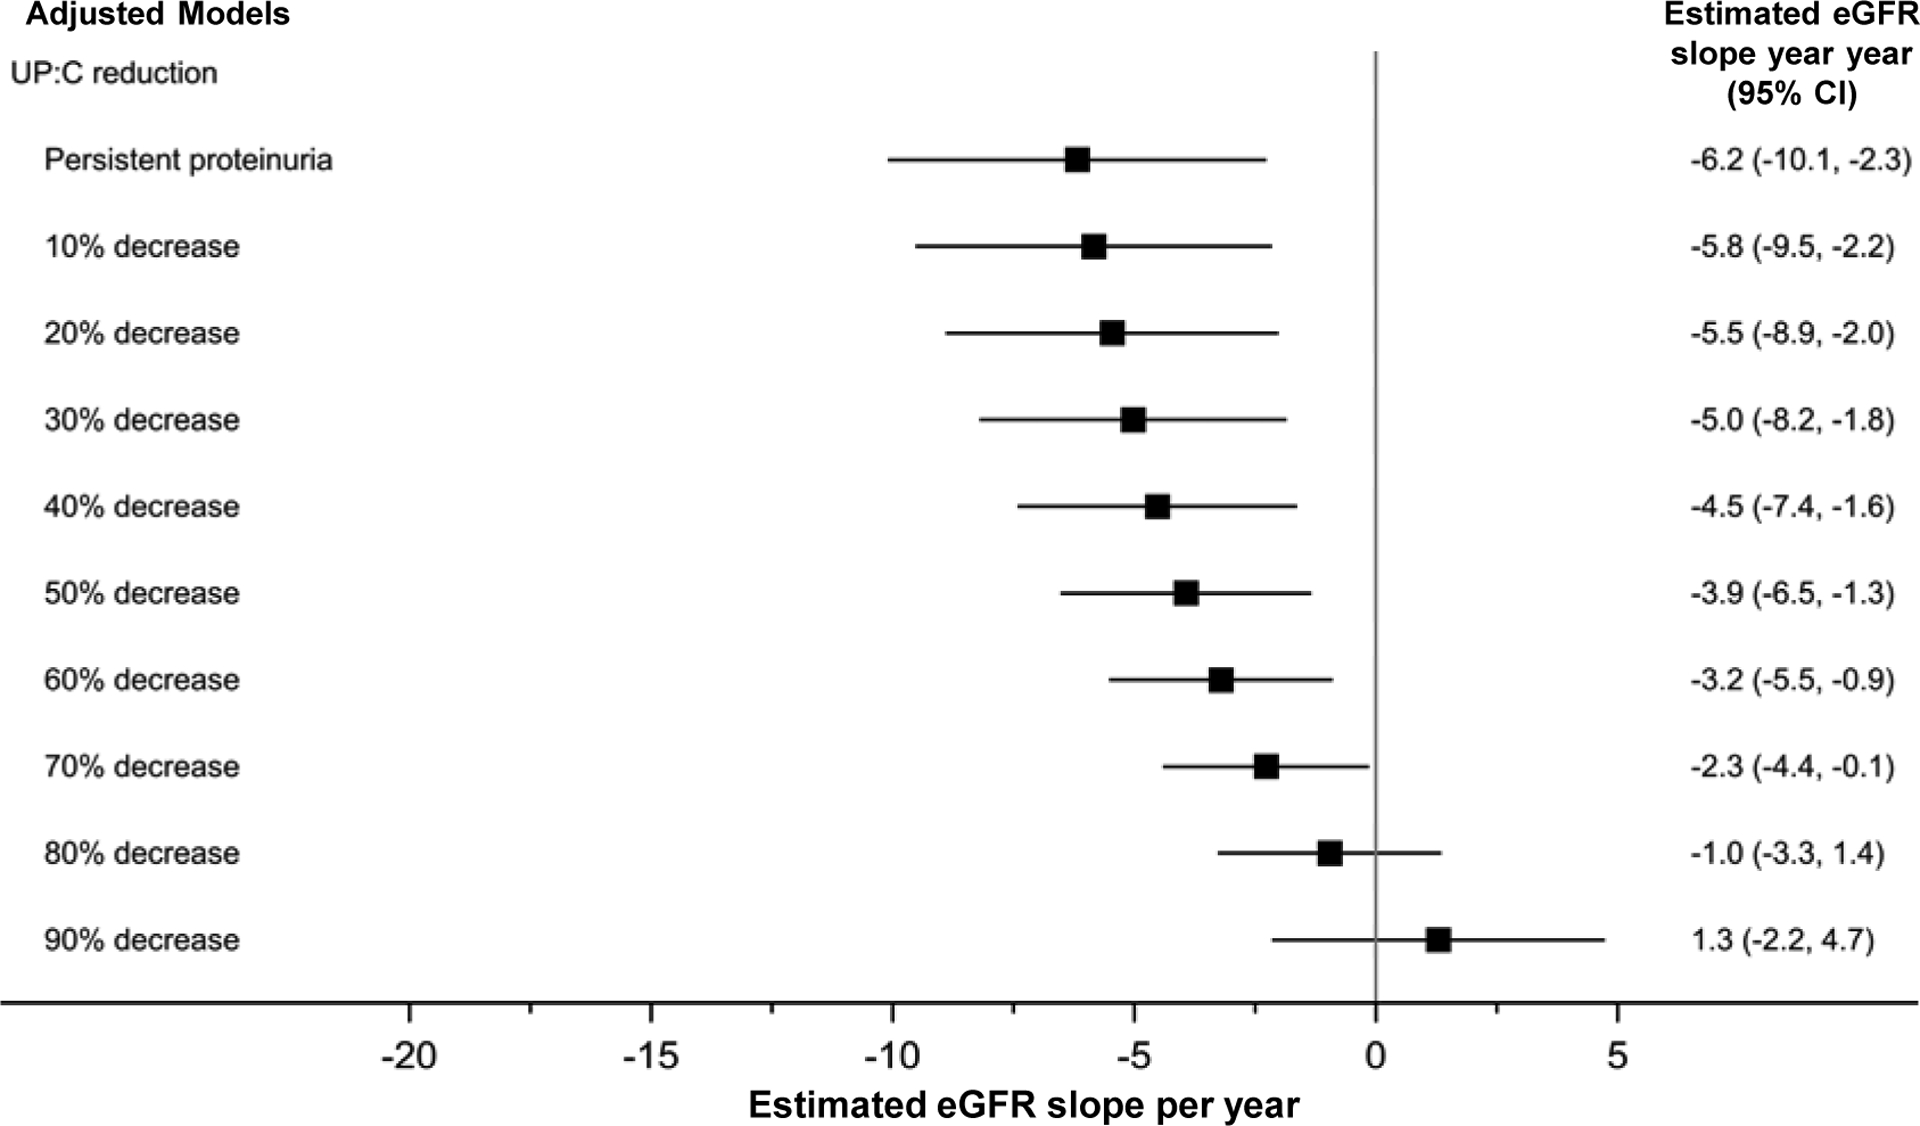
Figure 2. Reduction in proteinuria from baseline to week-26 associated with slower rate of eGFR decline from week-26 onward after adjusting for reaching complete remission. Results of adjusted linear mixed effects models (n=138 participants; n=752 observations).

Model adjusted for complete remission, APOL1 genotype, log-baseline UP:C, baseline eGFR, and treatment arm. Non-significant covariates removed during model selection include age, sex, race, systolic blood pressure index, and reduction in systolic blood pressure index (baseline - week 26). “Persistent proteinuria” refers to 0% reduction in UP:C. Multiple imputation by fully conditional specification was used to handle missing data. Due to an included interaction between complete remission and time, slopes above are for average complete remission at week 26 (21%). Observation “time” for eGFR outcome measurements=week 26 to last follow-up (maximum of month 54 from baseline). Abbreviations: 95% CI, 95% confidence interval; APOL1, Apolipoprotein L1; eGFR, estimated glomerular filtration rate; UP:C, urine protein: creatinine ratio.
