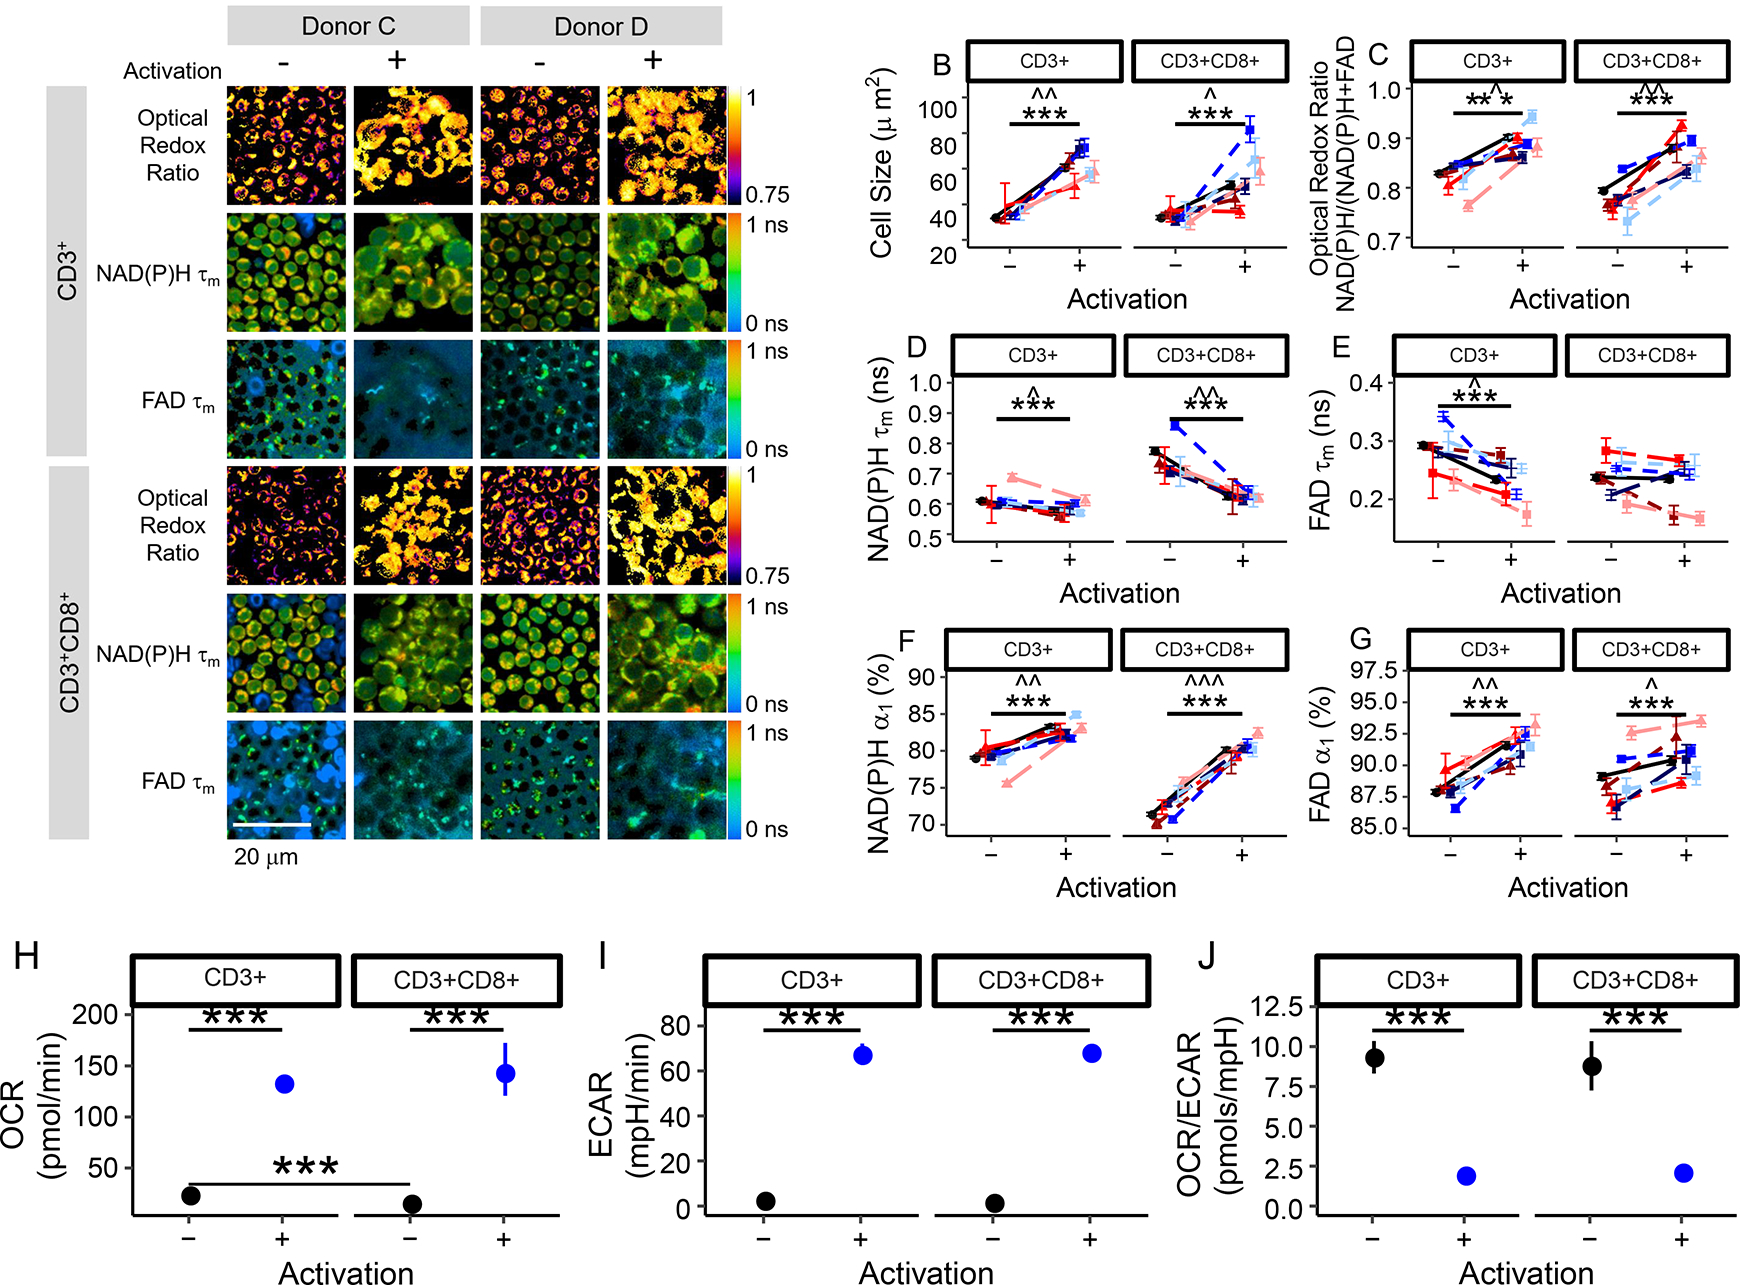
Fig. 1 |. NAD(P)H and FAD autofluorescence imaging reveals metabolic differences between quiescent and activated T cells.

(a) Representative optical redox ratio, NAD(P)H τm, and FAD τm images (4 images selected out of 202 images acquired from 6 different donors with similar results) of quiescent (columns 1, 3) and activated (columns 2, 4) CD3+ (rows 1–3) and CD3+CD8+ (row 4–6) T cells from two different donors. Scale bar is 20 μm. Cell size (b), optical redox ratio (c), NAD(P)H τm (d), FAD τm (e), NAD(P)H α1 (f), and FAD α1 (g) of quiescent and activated CD3+ and CD3+CD8+ T cells. Black circles represent mean of all data (6 donors), triangles (donors A [dark red], B [medium red], and F [light red]) represent data from female donors, squares (donors C [dark blue], D [medium blue], and E [light blue]) represent data from male donors. Each colour shade represents data from an individual donor. Data are mean +/− 99% CI. Horizontal lines indicate statistical comparisons, Stars (*** p<0.001) indicate statistical comparisons at the cellular level (n=4,877 biologically independent CD3+ T cells from 6 donors and n=3,478 biologically independent CD3+CD8+ T cells from 6 donors) from a two-sided logistic regression, generalized linear model using an α significance level of 0.05. Carets (B: ˆˆ p=0.001, ˆ=0.016; C: ˆ p=0.011, ˆˆ p=0.002; D: ˆ p=0.015, ˆˆ p=0.002; E: ˆ p=0.022; F: ˆˆ p=0.008, ˆˆˆ p<0.001; G: ˆˆ p=0.002, ˆ p=0.021) indicate significance at the donor level, n=6 biologically independent donors. Aggregated cellular data was compared using a double-sided paired t-test. (h-j) Cellular respiration increases in activated T cells. The oxygen consumption rate (OCR; panel H) and extracellular acidification rate (ECAR, panel I) are increased in activated bulk CD3+ and isolated CD3+CD8+ T cells. The ratio of OCR to ECAR (J) is significantly decreased in activated bulk CD3+ and isolated CD3+CD8+ T cells as compared with that of quiescent T cells. *** p<1*10−5, horizontal lines indicate statistical comparisons, double-sided, Student’s t-test, n=6 wells/group CD3+CD8+ isolation, n=12 wells/group CD3+ isolation (1 donor). Mean +/− 95% CI. Error bars smaller than the symbol for the mean are not shown.
