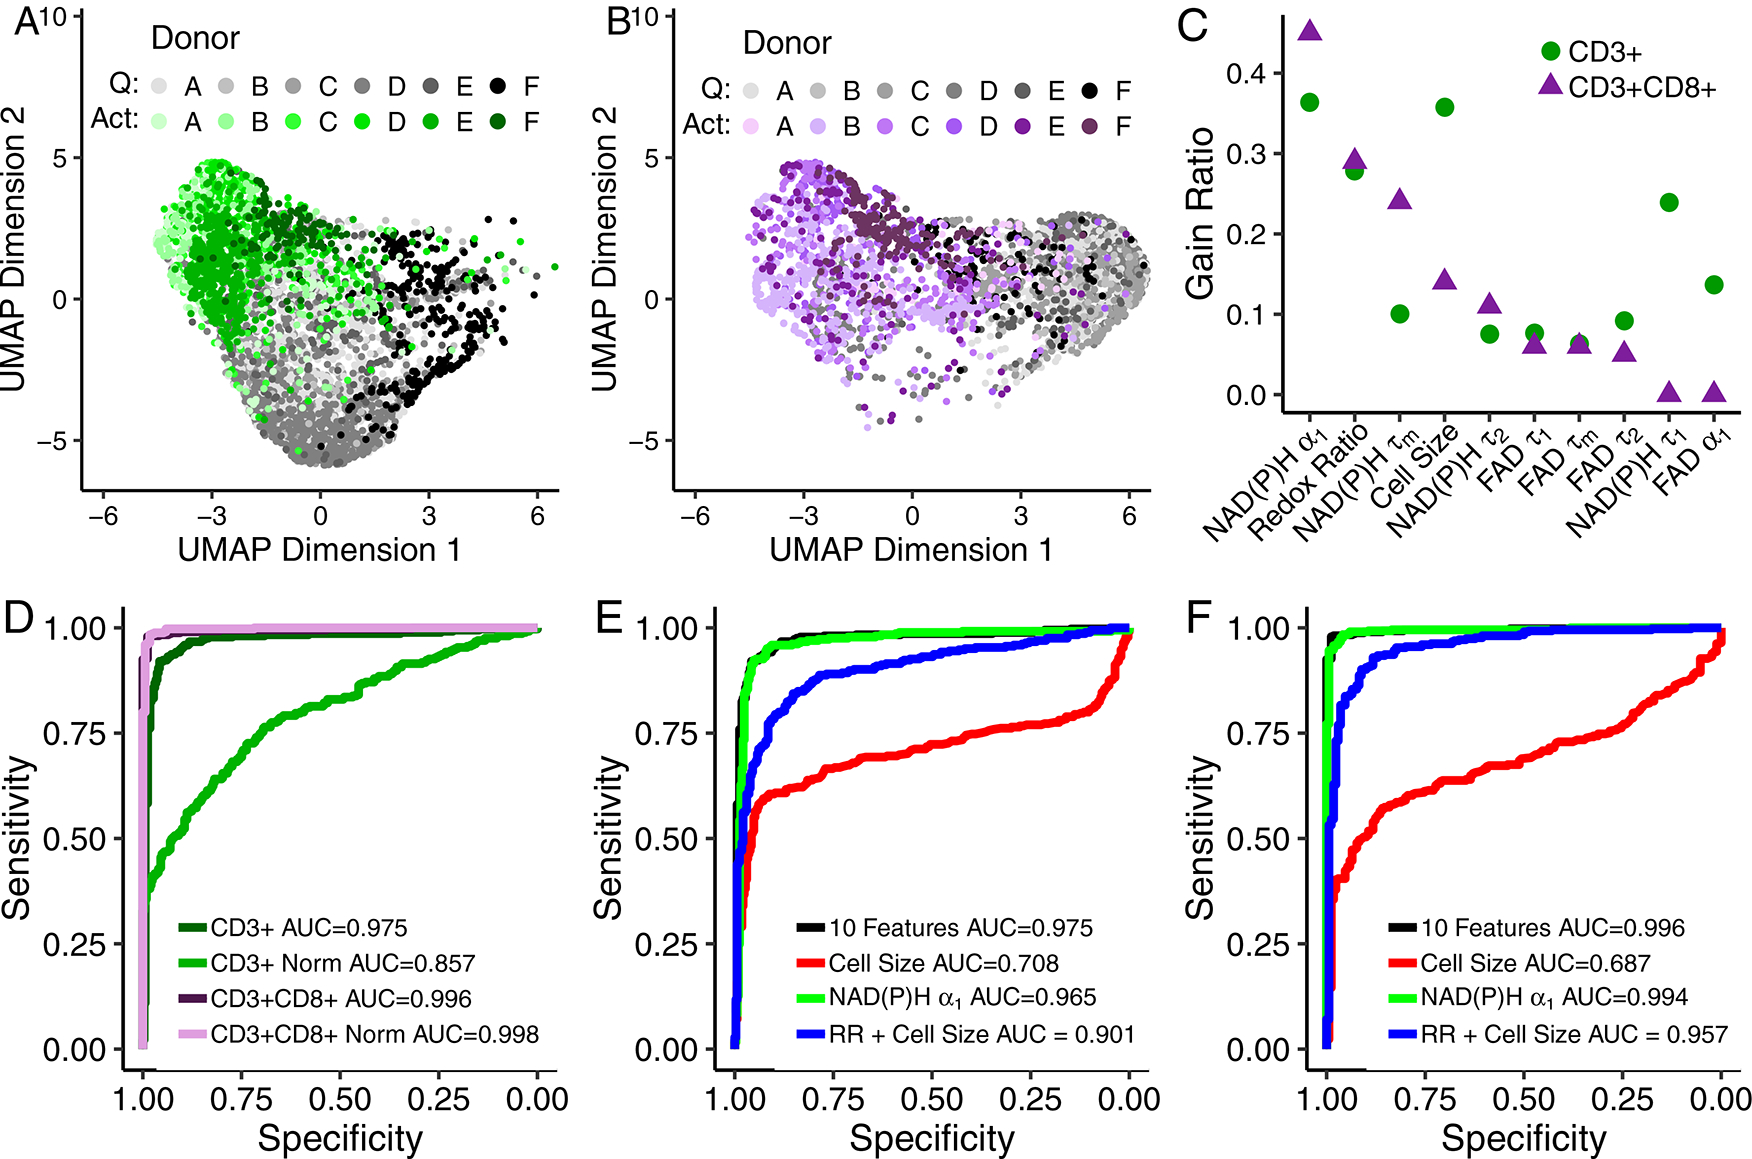
Fig 2 |. Autofluorescence imaging endpoints allow classification of quiescent and activated T cells.

(A-B) UMAP data reduction technique allows visual representation of the separation between quiescent (“Q”) and activated (“Act”) bulk CD3+ (A) and isolated CD3+CD8+ (B) T cells. Each colour corresponds to a different donor, greys correspond to quiescent cells and green or purple to activated CD3+ or CD3+CD8+ T cells, respectively. Data are from 6 donors. Each dot represents a single cell, n=4,877 CD3+ T cells and n=3,478 CD3+CD8+ T cells. (C) Feature weights for classification of quiescent versus activated T cells by the gain ratio method. Analysis was performed at the cellular level with data from 6 donors. (D) ROC curves of the test data for logistic regression models for classification of activation state within bulk CD3+ T cells, bulk CD3+ T cells normalized within each donor (CD3+ Norm), isolated CD3+CD8+ T cells, and isolated CD3+CD8+ T cells normalized within each donor (CD3+CD8+ Norm). (E-F) ROC curves of the test data for logistic regression classification models computed using different features for the classification of (E) quiescent or activated bulk CD3+ or (F) isolated CD3+CD8+ T cells. Models for subfigures D-F were trained on cells that lacked same cell validation data from donors A, B, C, and D but were known to be quiescent or activated by culture conditions (n = 4,131 biologically independent CD3+ cells, n=2,655 biological independent CD3+CD8+ cells), and cells from donors B, E, and F with CD69 validation of activation state were used to test the models (n = 696 biologically independent CD3+ cells, n=595 biologically independent CD3+CD8+ cells). Redox Ratio = NAD(P)H/(NAD(P)H+FAD).
