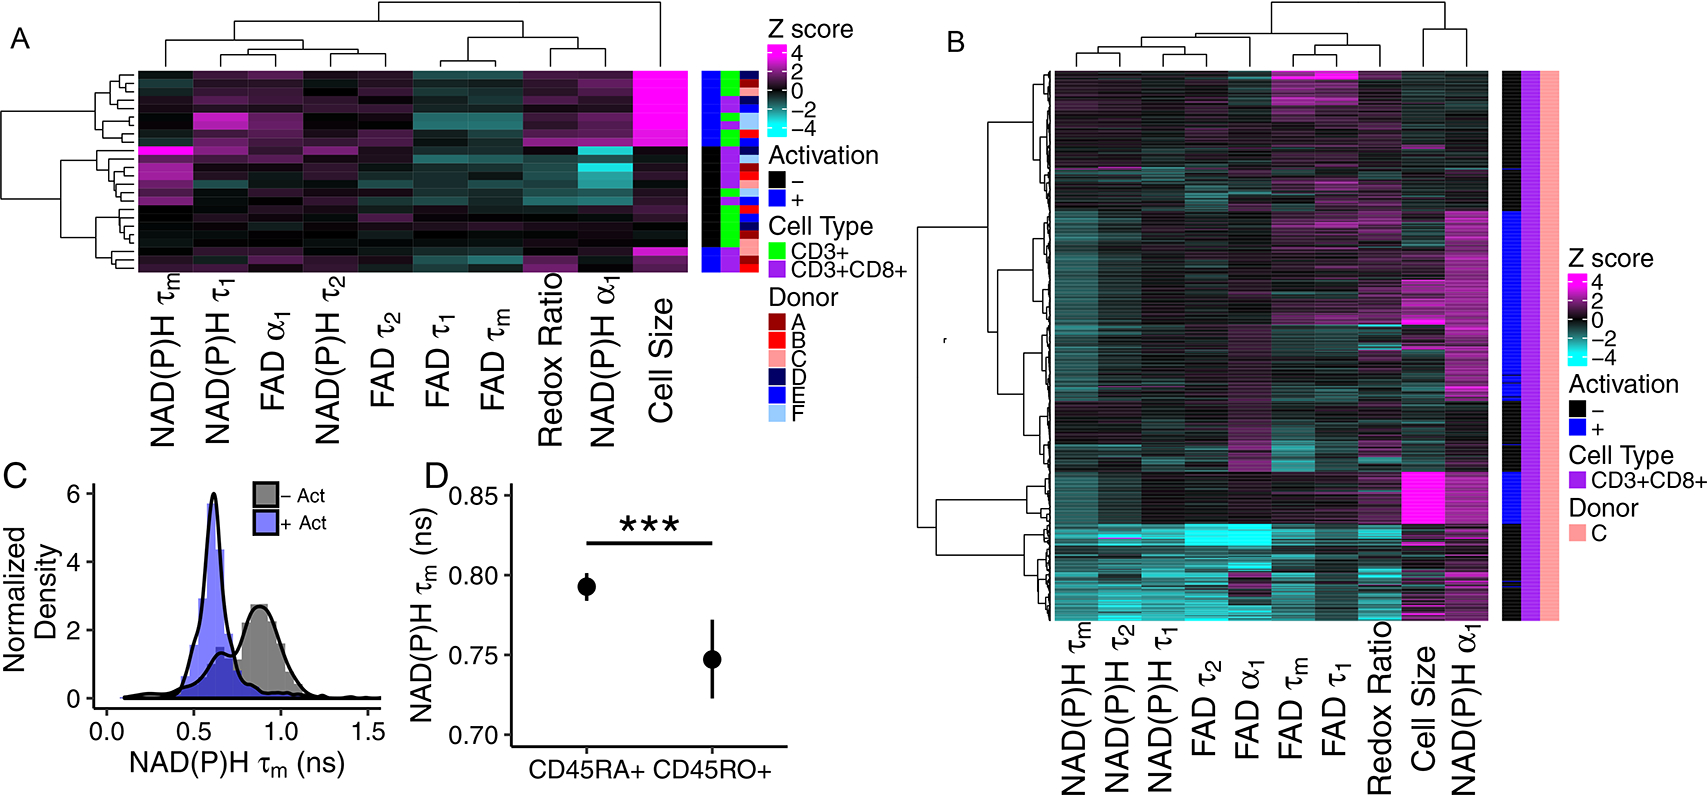
Fig 3 |. Autofluorescence imaging reveals inter- and intra-donor T cell heterogeneity.

(A) Heatmap of z-scores of NAD(P)H and FAD autofluorescence imaging endpoints where each row is the mean data aggregating all cells from a single donor, subtype (CD3+ or CD3+CD8+), and activation, n=6 biologically independent donors. Data clusters by activation state and isolation (bulk CD3+ or isolated CD3+CD8+). (B) Heatmap of z-scores of NAD(P)H and FAD autofluorescence imaging endpoints of CD3+CD8+ T cells from a single donor, each row is a single cell (n=635 cells). Distinct clusters are identified within the quiescent and activated CD3+CD8+ T cells. (C) Histogram analysis of NAD(P)H τm reveals two populations in quiescent CD3+CD8+ T cells across all 6 donors (n=2126 quiescent cells, 1352 activated cells, - Act = quiescent cells, + Act = cells exposed to anti-CD3/CD2/CD28 for 48hr). (D) NAD(P)H τm is decreased in CD45RO+ CD3+CD8+ T cells compared to NAD(P)H τm of CD45RA+ CD3+CD8+ T cells (CD45RA+ n=265 cells, CD45RO+ n=33 cells from 3 donors, *** p=0.00058, two-sided logistic regression, generalized linear model. p>0.05 for data aggregated to the donor level, two-sided paired t-test.) Mean +/− 95% confidence interval. Redox Ratio = NAD(P)H/(NAD(P)H+FAD).
