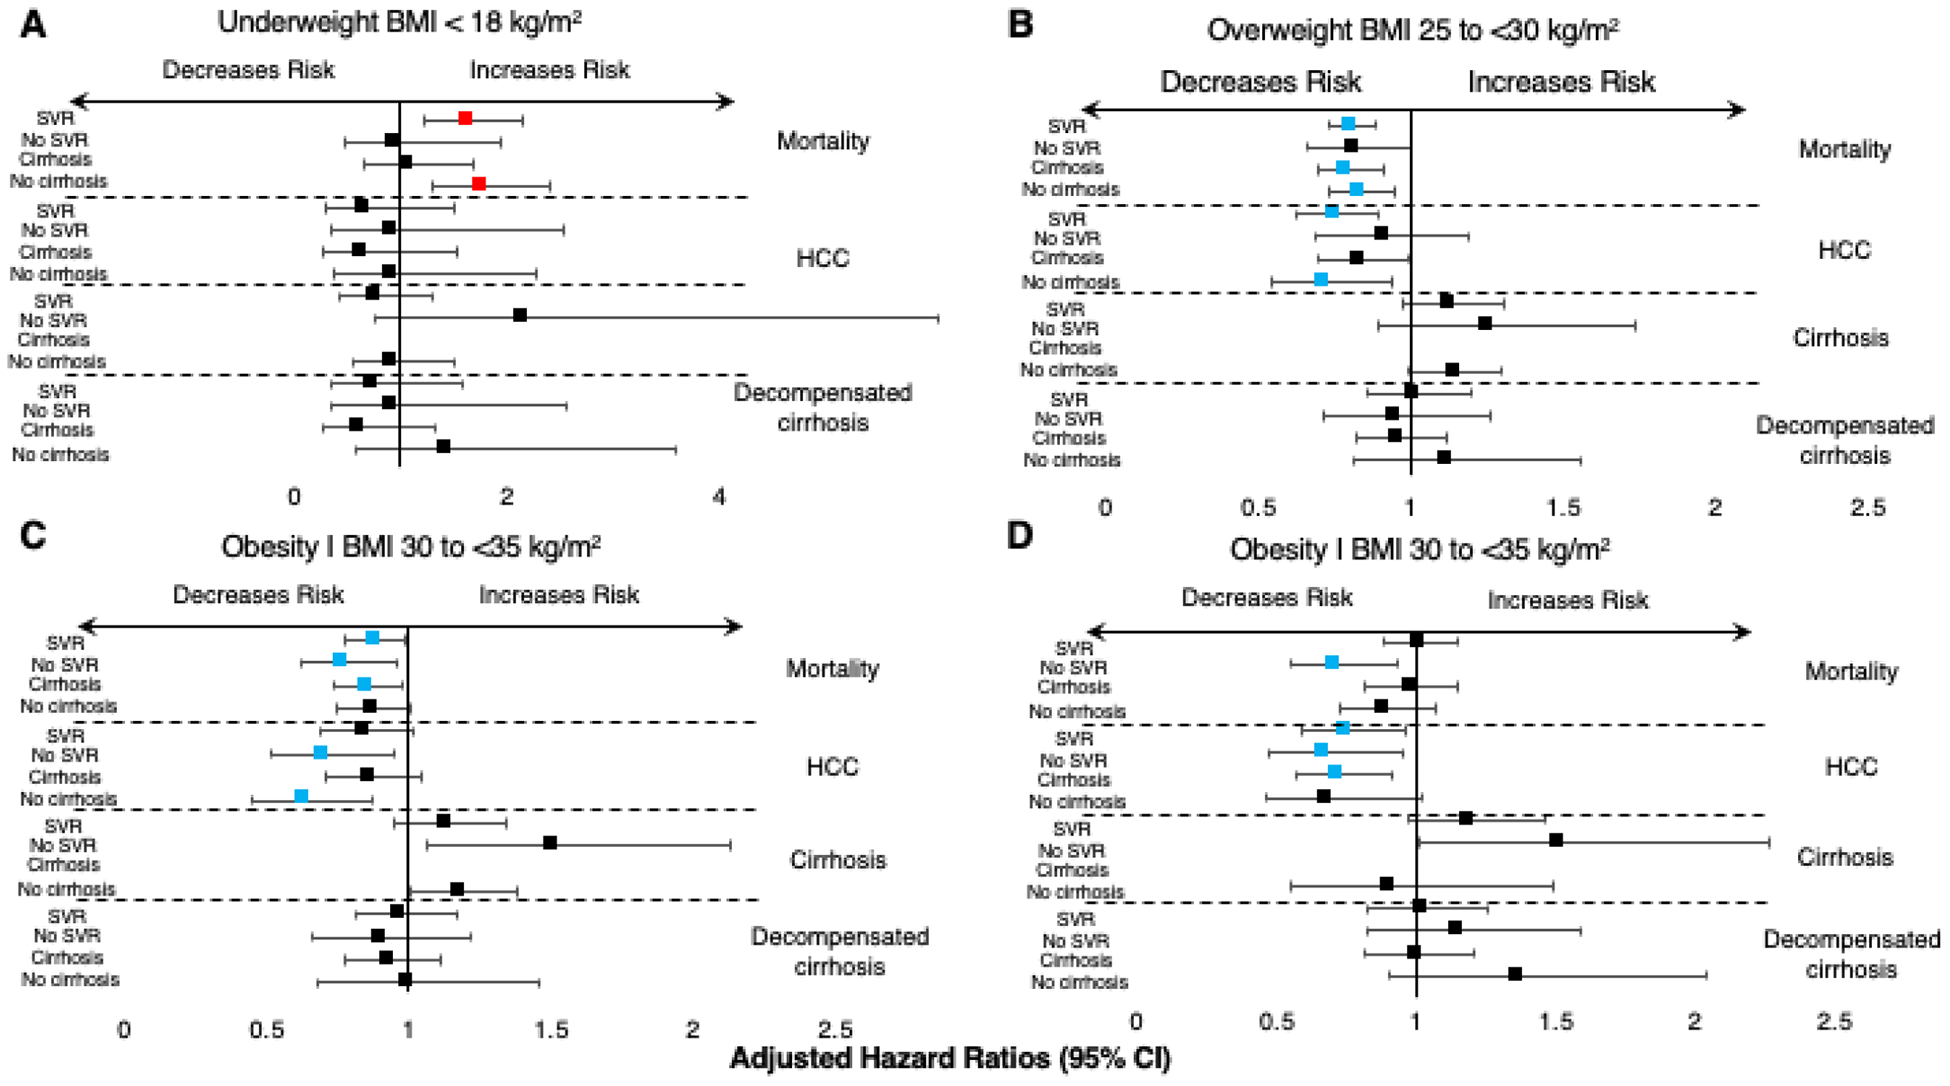
Figure 2-. Forest plot of the adjusted hazard ratios for mortality and liver-related outcomes in patients with different categories of BMI.

Panels A, B and C depict overweight (BMI 25–30 kg/m2), type I obesity (BMI 30–35 kg/m2) and type II-III obesity (BMI > 35 kg/m2) categories for patients (left side, top to bottom): 1. Reached SVR; 2. Did not reach SVR; 3. With baseline cirrhosis; 4. Without baseline cirrhosis, for all outcomes (labeled on the right).
