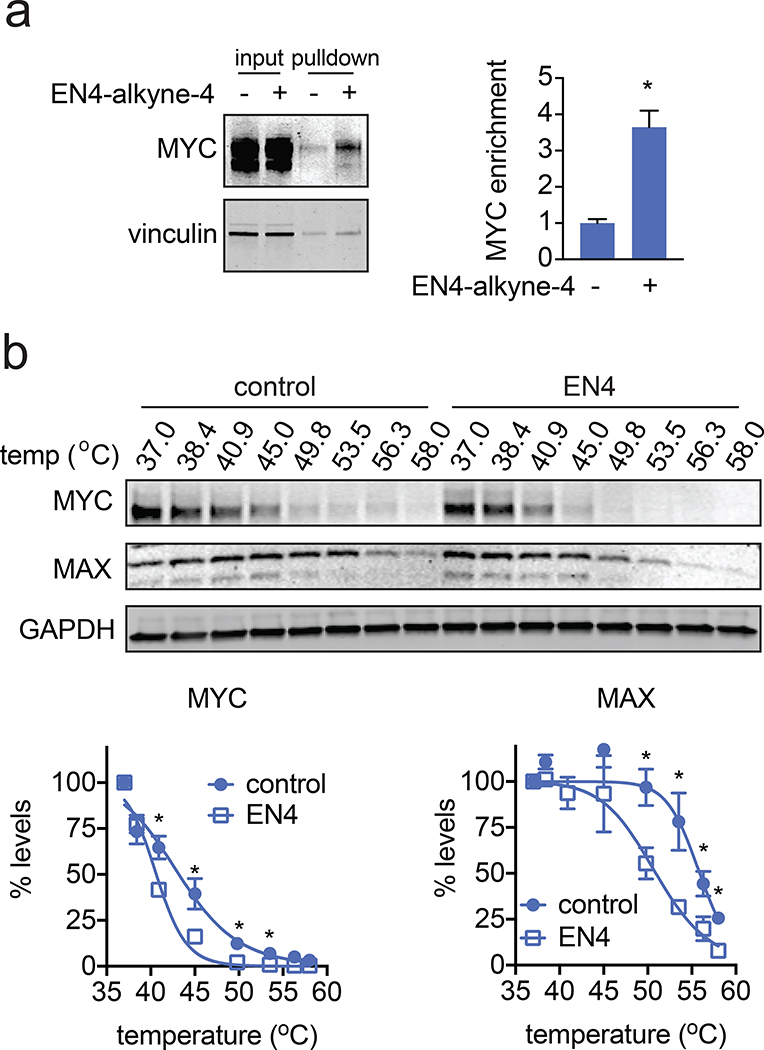
Figure 3. Characterizing EN4 engagement of MYC in cells.
(a) EN4-alkyne-4 enrichment of endogenous MYC in 231MFP breast cancer cells. 231MFP cells were treated with DMSO vehicle or EN4-alkyne-4 (50 μM) for 4 h. Resulting cell lysates were subjected to CuAAC with an azide-functionalized biotin handle and EN4-alkyne-4-labeled proteins were subsequently avidin-enriched, run on SDS/PAGE, and blotted for c-MYC and loading control vinculin. Also shown is c-MYC and vinculin expression from the input protein that went into the pulldown. Gel shown is a representative image of n=3 biologically independent samples/group and fluorescence is quantified in the bar graph shown on the right. (b) Cellular thermal shift assay showing c-MYC, MAX, and loading control GAPDH protein levels in 231MFP cells treated with vehicle DMSO or EN4 (50 μM) for 2 h. Shown are representative gels and quantification of MYC and MAX protein levels, n=4 biologically independent samples/group normalized to MYC or MAX protein levels at 37o C, respectively. Data shown in (a, b) are average ± sem. Statistical significance was calculated with unpaired two-tailed Student’s t-tests and is expressed as *p<0.05 compared to vehicle-treated controls in (a) and vehicle-treated controls at each temperature in (b). This figure is related to Figure S3.

