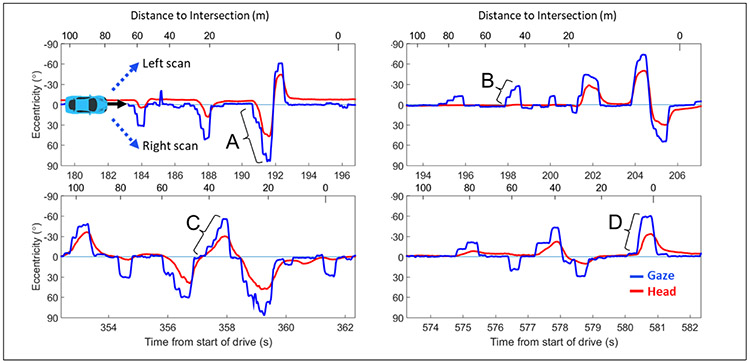
Figure 1.
Examples of the diversity of individuals’ scanning patterns on approach to an intersection (gaze = blue, head = red). Sections of these plots will be used in subsequent figures to illustrate different aspects of the gaze scan algorithm. Each plot shows data from 100 to 0 m before the intersection. The black arrow in front of the car in the top left plot indicates the travel direction (i.e. left to right means forward in time). Participants decelerated at different rates, hence the different spacings between tick marks on the top (distance-to-intersection) axis. The dotted blue arrows in the top left plot indicate the direction of the gaze and head scans. Any scan below 0° eccentricity is a scan to the left and any scan above 0° eccentricity is a scan to the right. Some gaze scans were made with large head movements (e.g. A), while others were made without any head movements (e.g. B). Some large (60°) scans were slow and comprised of multiple saccades (e.g., C) while others were quick and comprised of only one saccade (e.g., D).

