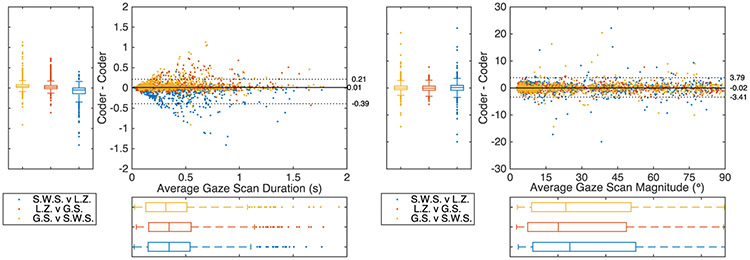
Figure A.4.
Bland-Altman plots for the comparisons between coders for gaze scan duration (left) and magnitude (right). Here, color represents the different comparisons. Box plots are provided in lieu of histograms to demonstrate the differences between coders, which was minimal. The dotted horizontal lines represent the average limits of agreement (LoA) and the numbers correspond to the average limits with the median between the two LoAs.

