
Figure 3:
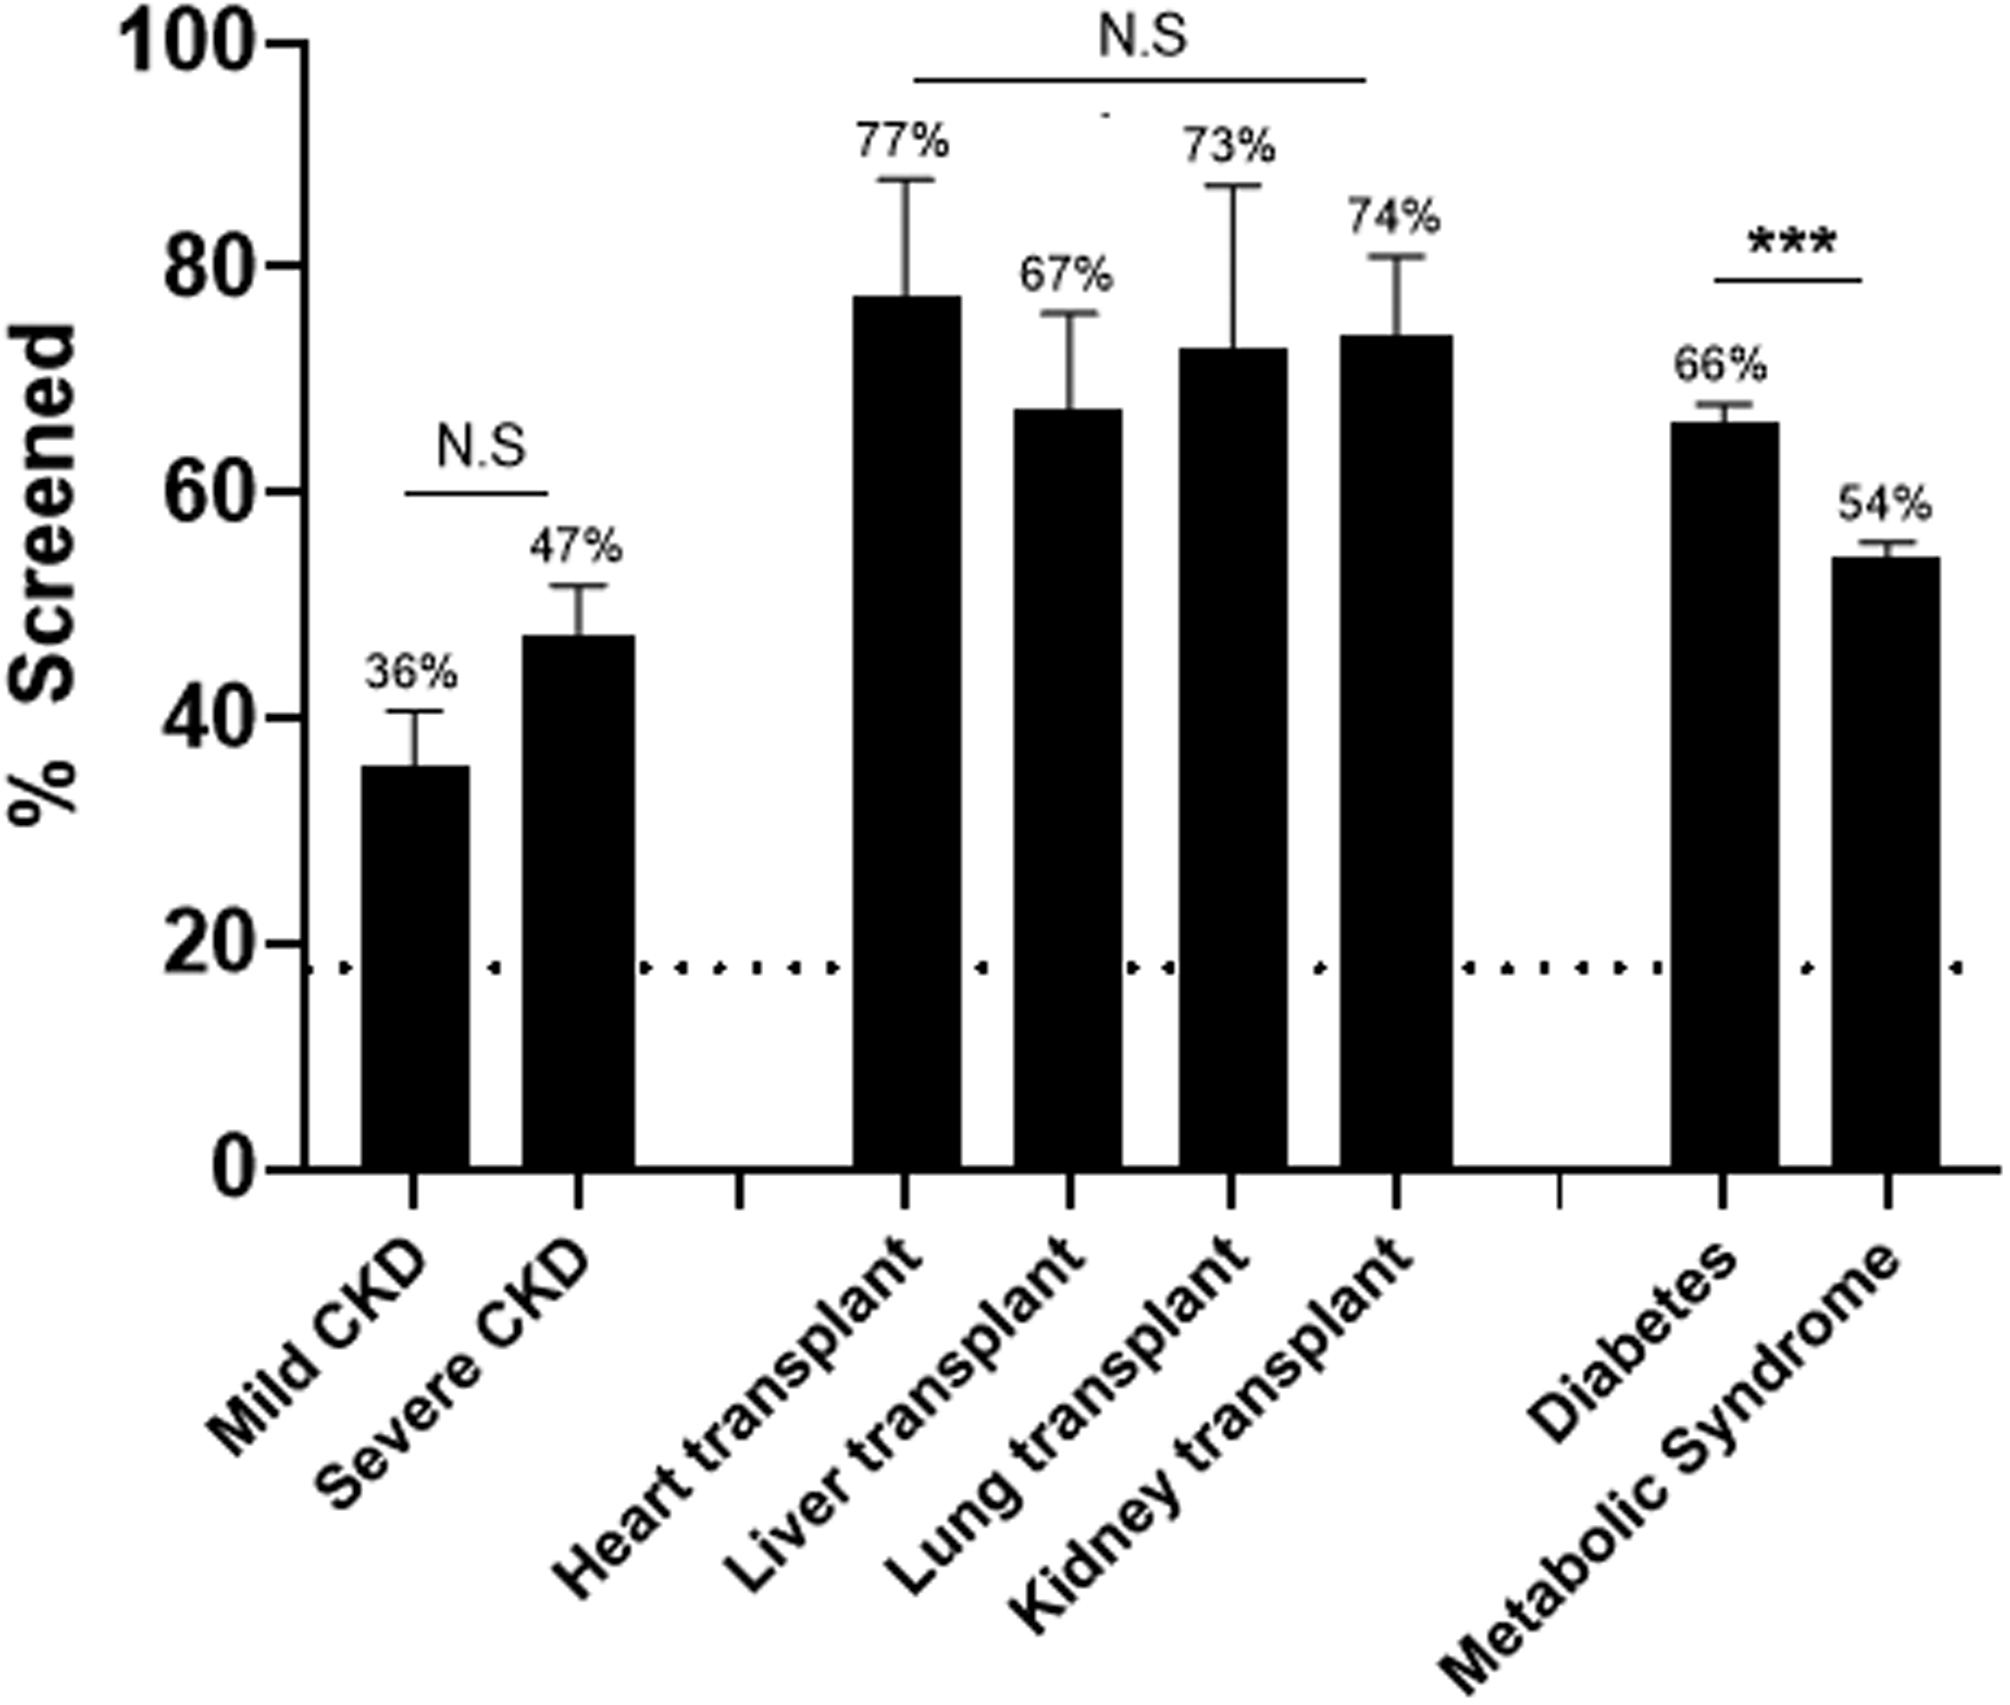
Rate of universal lipid screening among subsets of high-risk cohorts. Dashed horizontal line represents standard-risk screening percentage. Error bar represents standard deviation. ***, P<0.001; NS, not significant.
Official websites use .gov
A
.gov website belongs to an official
government organization in the United States.
Secure .gov websites use HTTPS
A lock (
) or https:// means you've safely
connected to the .gov website. Share sensitive
information only on official, secure websites.
Rate of universal lipid screening among subsets of high-risk cohorts. Dashed horizontal line represents standard-risk screening percentage. Error bar represents standard deviation. ***, P<0.001; NS, not significant.