Figure 3.

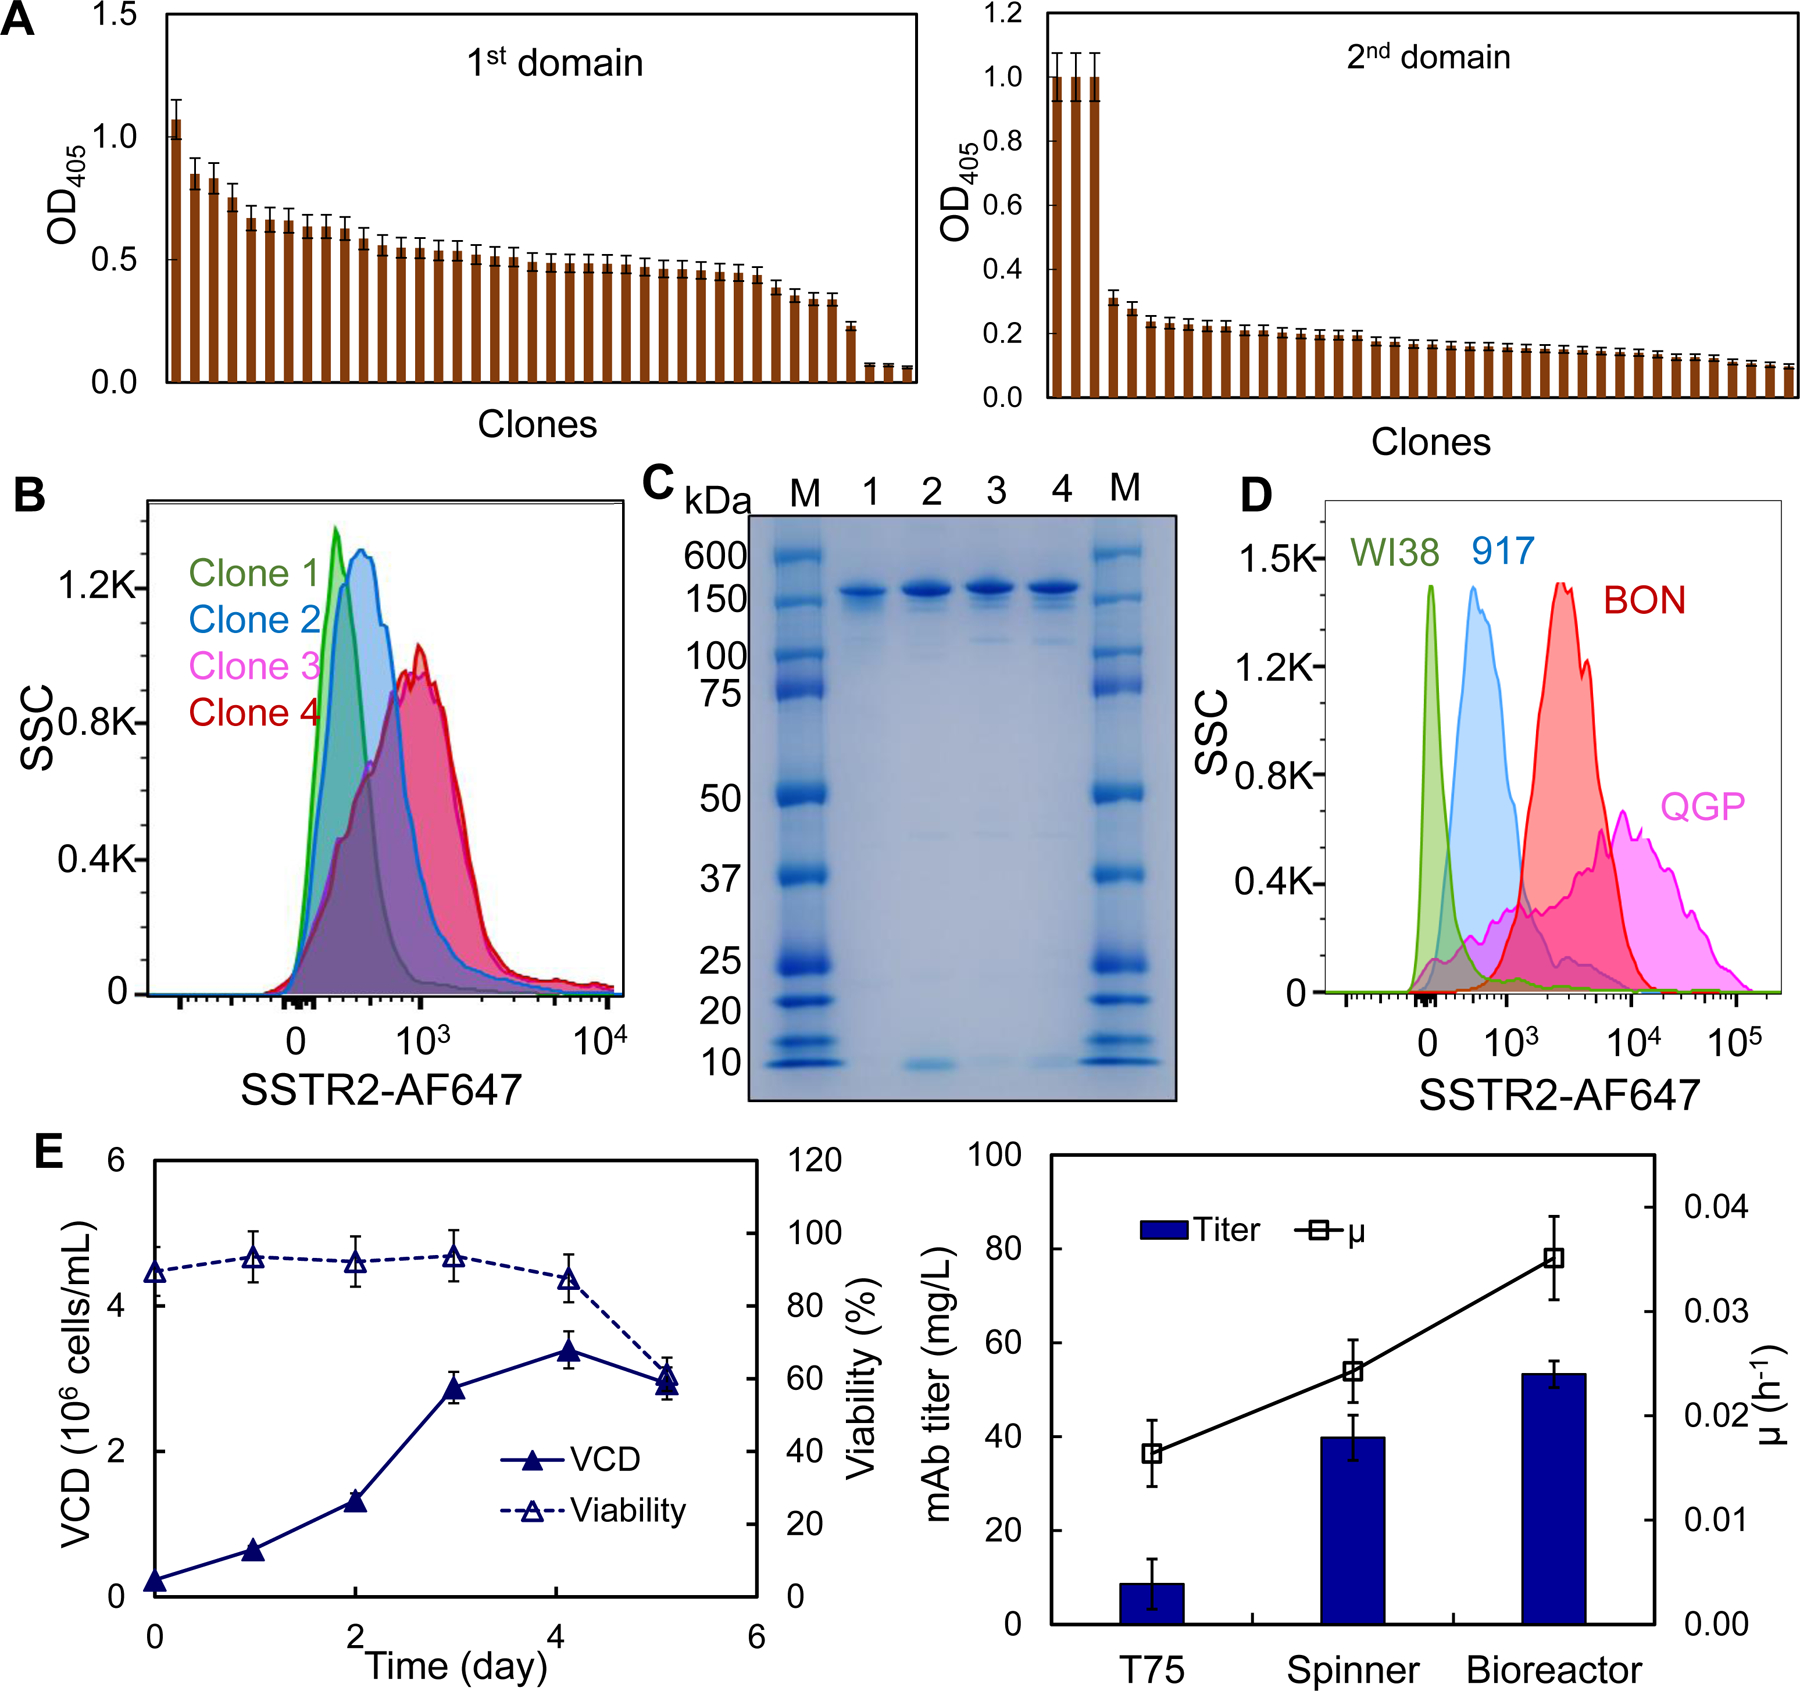
Anti-SSTR2 mAb development and production. A, Rank of top anti-SSTR2 mAb clones based on the titer in ELISA screening (data represent mean ± SEM, n = 3). B, Evaluation of top 4 clones using flow cytometry. C, SDS-PAGE to confirm the integrity and purity of mAb (M: marker; 1–4: Clones 1–4). D, Evaluation of SSTR2 binding of lead clone in control cell lines (WI38 and 917) and NET cell lines (BON and QGP). E, mAb production and hybridoma cell growth in fed-batch suspension cultures (data represent mean ± SEM, n = 3). Viable cell density (VCD):  , cell viability:
  , specific growth rate (μ):
  .
.
