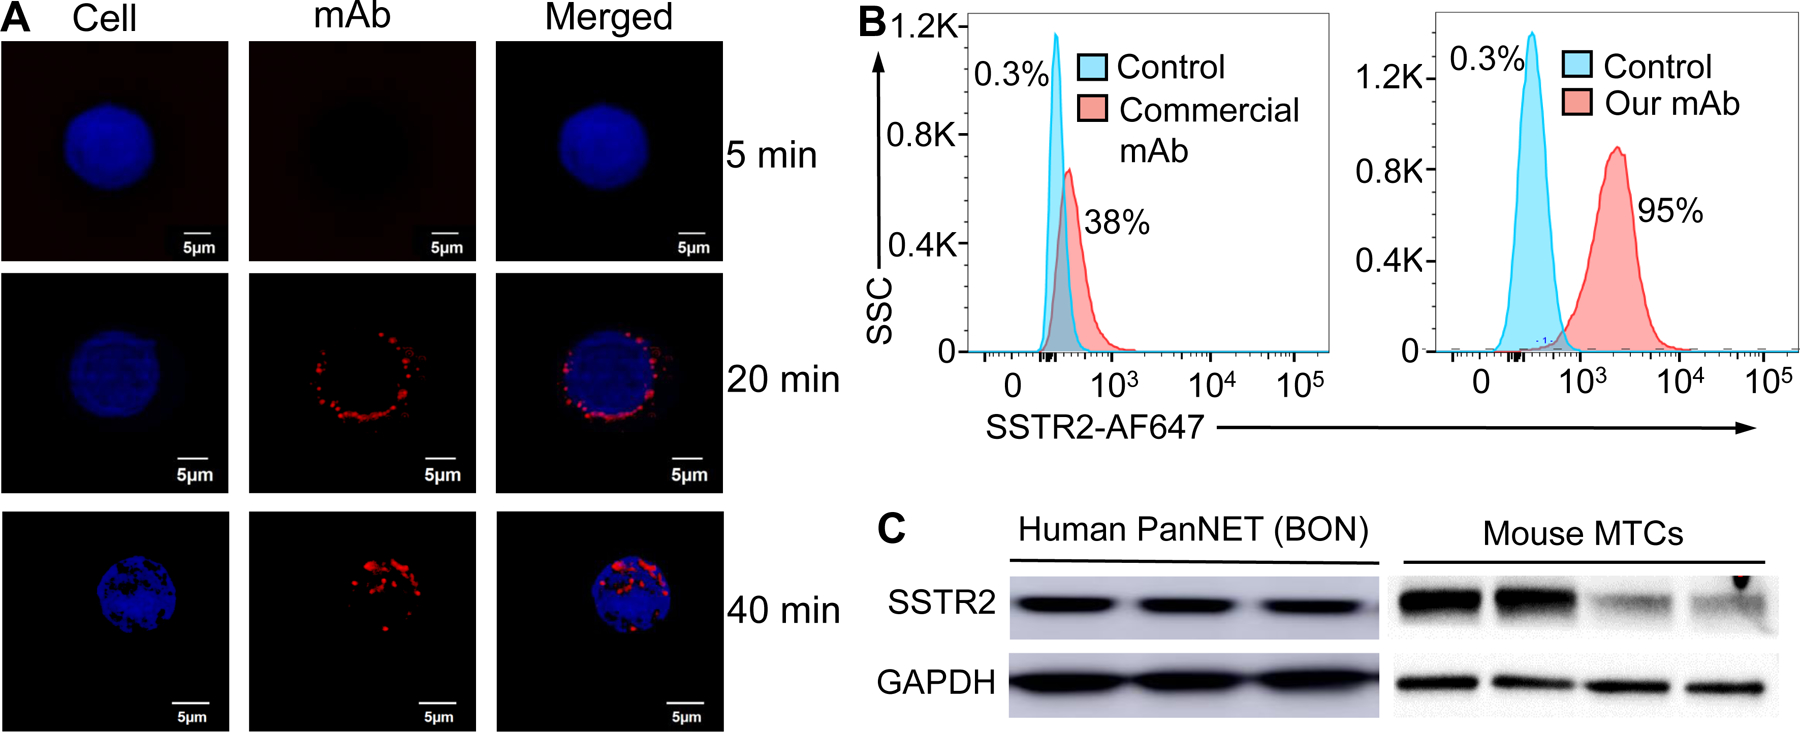
Figure 4.

Evaluation of surface binding by anti-SSTR2 mAb. A, Live-cell CLSM dynamic imaging of anti-SSTR2 mAb. Two-color CLSM: whole cell labeled with GFP (displayed as blue) and SSTR2 mAb-MMAE labeled with AF647 (red). Scale bar equals 5 μm. B, Flow cytometry to analyze the surface binding of anti-SSTR2 mAb to NET cell (BON-1) and negative control cell (917). Stained with 1 μg of mAb-AF647/million cells on ice for 30 mins. C, Western blotting of human NET (BON) xenografted tissue and mouse MTC tissues (n = 3–4) using our mAb.
