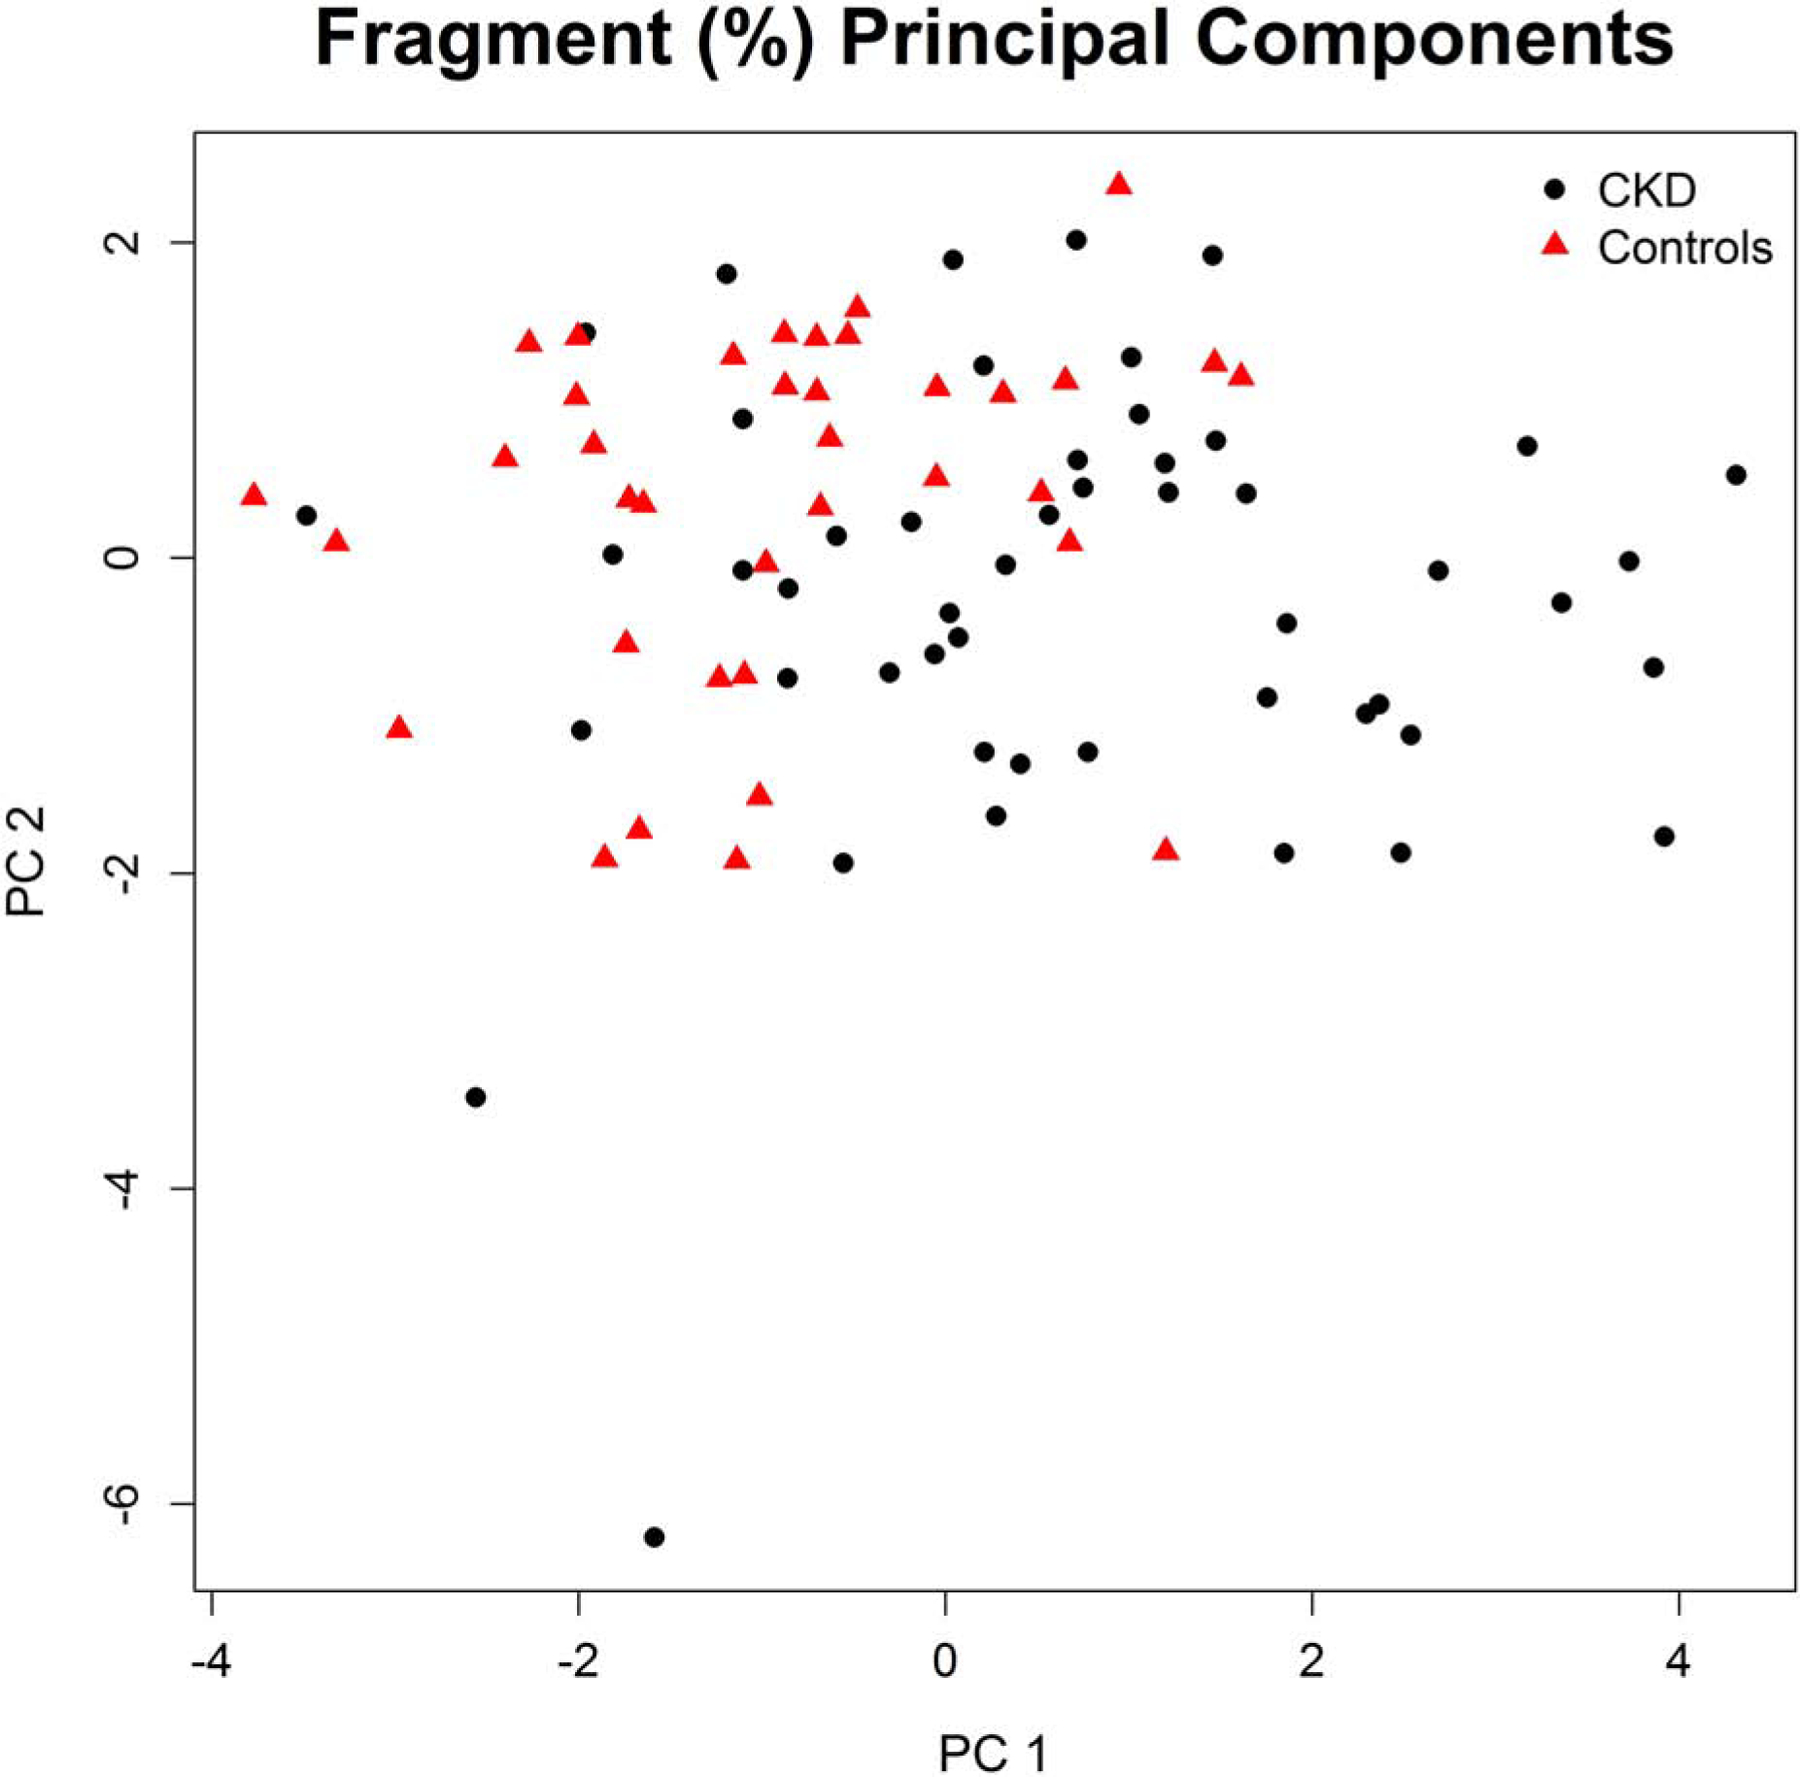
Figure 2.

Visualization of principal component analysis of the proportions of different circulating osteocalcin fragments. The first principal component (PC1) has the greatest factor loadings for the following fragments: Y[1–49]V (Intact), pE[4–49]V, pE[4–48]P, and W[5–49]V. The second principal component (PC2) has the greatest factor loadings for the following fragments: Y[3–49]V, Y[1–48]P, L[2–49]V, and Y[3–48]P. Together, PC1 and PC2 explain 39% and 22% of the total variability in fragment proportions, respectively, or cumulatively explain 62% of the total variability in the proportions of different circulating osteocalcin fragments. The value of PC1 differed significantly (p < 0.0001) between participants with chronic kidney disease (CKD) and controls.
