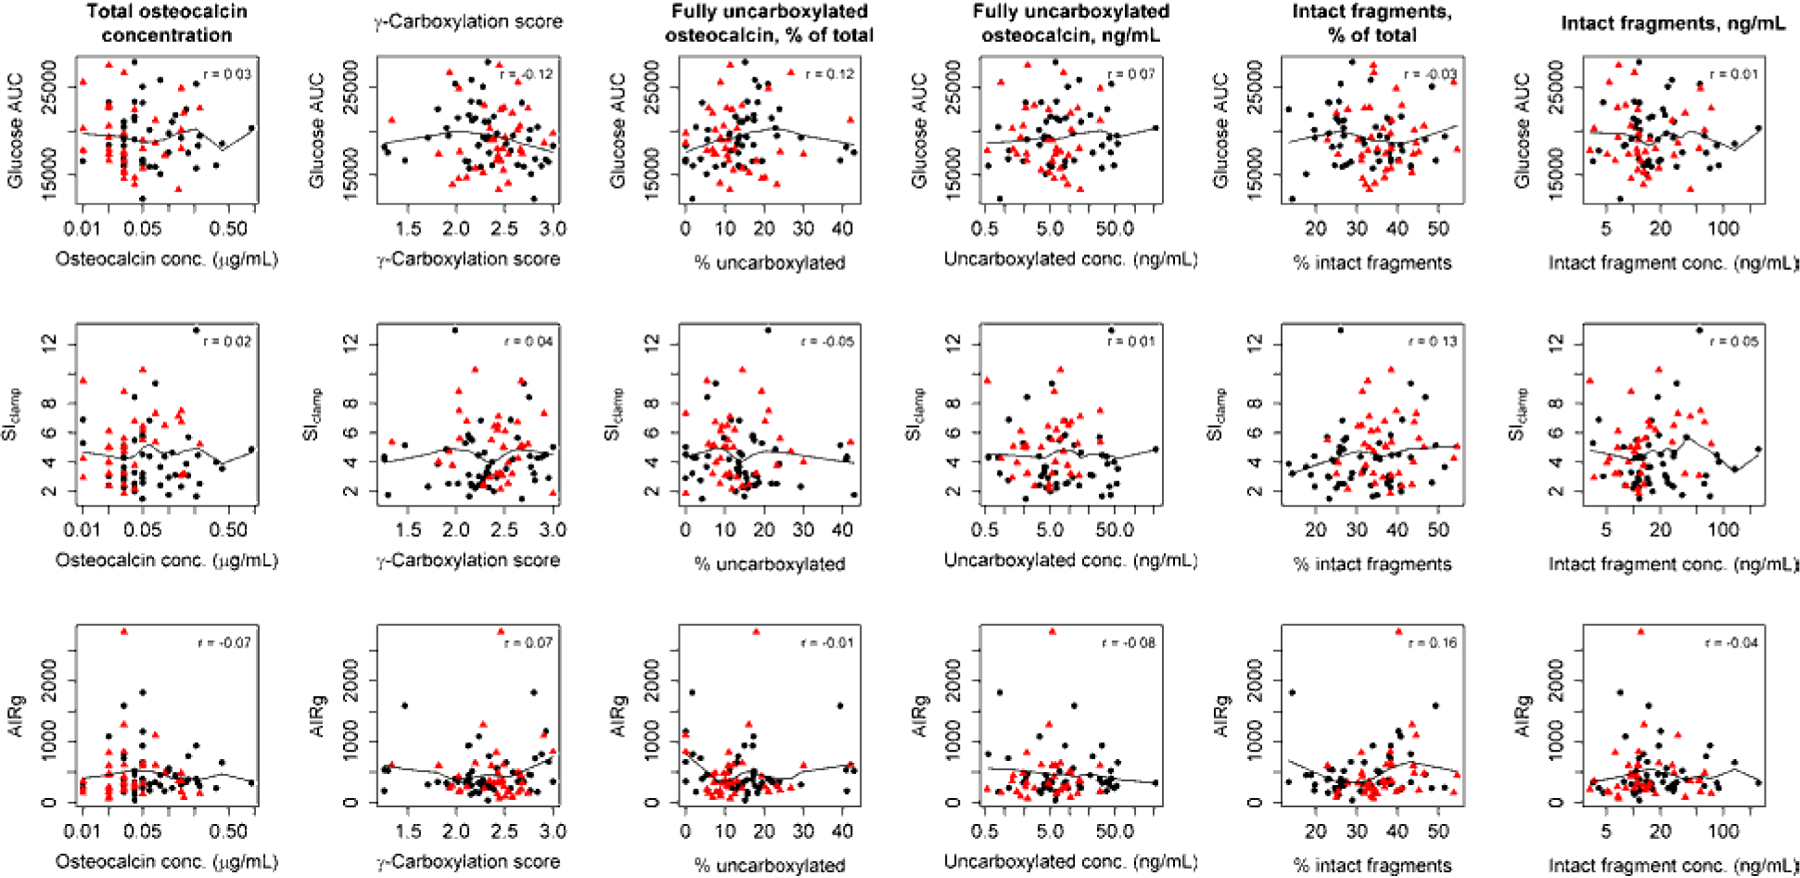
Figure 3.

Relationship between total osteocalcin concentration, the osteocalcin carboxylation score, the percentage of fully uncarboxylated osteocalcin, the concentration of fully uncarboxylated osteocalcin, the percentage of intact osteocalcin fragments, and the concentration of intact fragments and glucose tolerance, as measured by the area-under-the-curve (AUC) glucose in a 2-hour oral glucose tolerance test (first row); insulin sensitivity (Si), as measured by hyperinsulinemic-euglycemic clamp (second row); and pancreatic beta-cell function, as measured by the acute insulin response to glucose (AIRg) during a frequently sampled intravenous glucose tolerance test (third row). Black dots: chronic kidney disease. Red triangles: controls.
