
Figure 1.
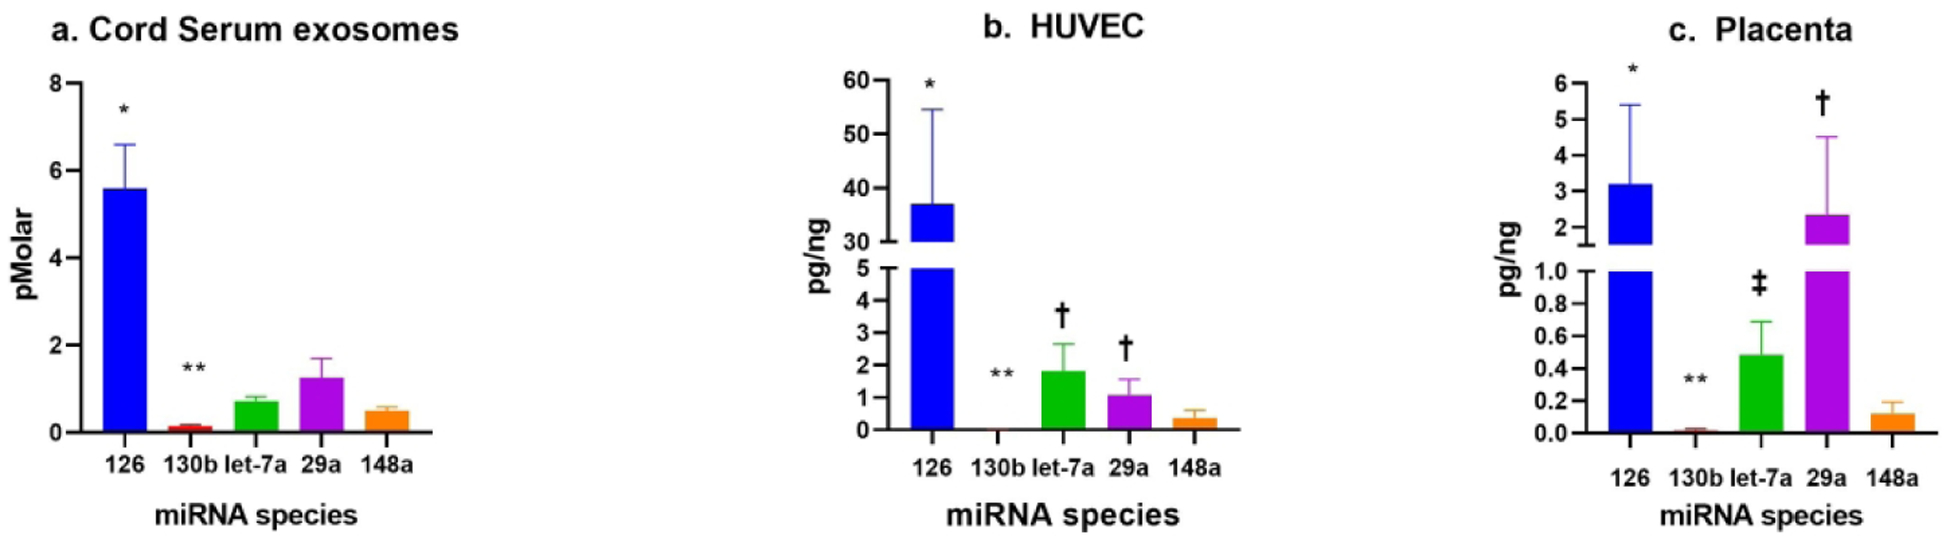
Abundance of miRNA within fetal serum exosomes, HUVEC and Placenta respectively (a-c).
a. Mean ± SEM. * = p<0.05: Abundance of miR-126 compared to all other miRNAs. ** =p<0.05: Abundance of miR-130b compared to all other miRNAs. Actual concentration of miR-130b in fetal exosomes was 0.15 pMolar.
b. Mean ± SEM. * = p<0.05: Abundance of miR-126 compared to all other miRNAs. † = p<0.05: Abundance of miR-let-7a-5p and miR-29a-3p compared to miR-148a-3p. ** = p<0.05: Abundance of miR-130b compared to all other miRNAs. Actual concentration of miR-130b in HUVEC was 0.014 pg/ng.
c. Mean ± SEM. * = p<0.05: Abundance of miR-126–3p as compared to miR-let-7a-5p, miR-148a-3p and miR-130b-3p. † = p<0.05: Abundance of miR-29a-3p as compared to miR-let-7a-5p and miR-148a-3p. ‡ = p<0.05: Abundance of miR-let-7a 5p as compared to miR-148a-3p. **= p<0.05: Abundance of miR-130b compared to all other miRNAs. Actual concentration of miR-130b in placenta was 0.015 pg/ng.