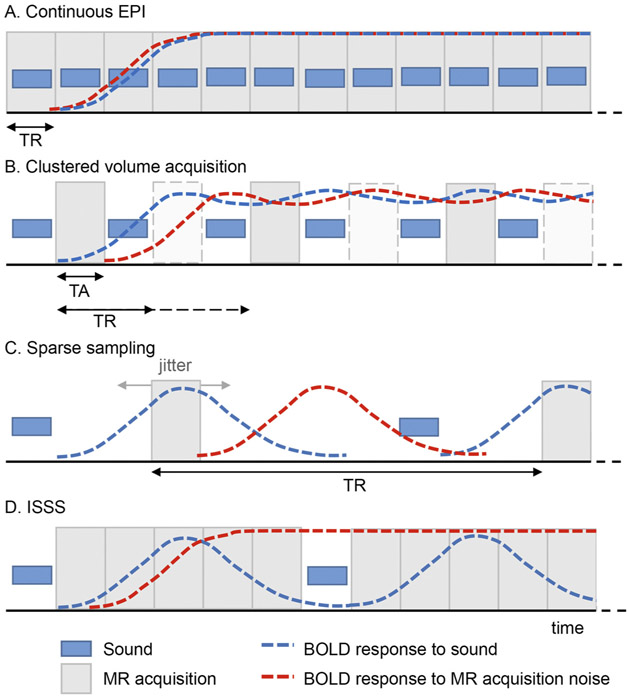
Fig. 1. Auditory neuroimaging approaches.
The blue boxes represent sound representation, and the gray boxes represent MR data acquisition. The blue and red dashed line represents the BOLD response evoked by the sounds and the MR acquisition noise, respectively. The various approaches represent a trade-off between (lack of) BOLD signal contamination and experimental power, with continuous EPI (A) and sparse imaging (C) reflecting the extremes, and clustered volume acquisition and interleaved silent steady state (ISSS; B-D) representing compromises. TA = acquisition time; TR = repetition time.

