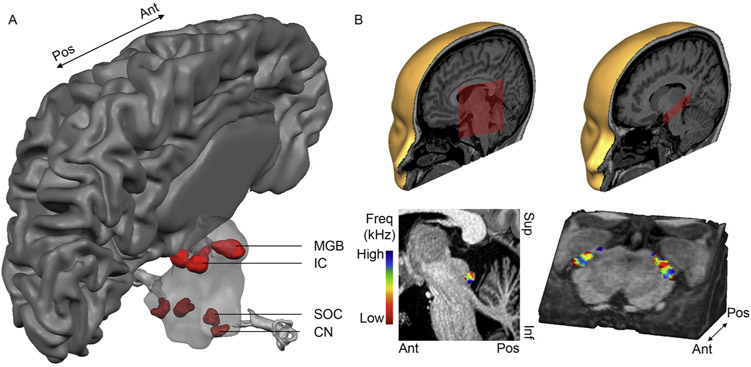
Fig. 2. Ultra-high field imaging of the auditory pathway.
(A) Using functional MRI at 7 T, auditory functional responses can be reliably measured throughout the auditory pathway in an individual brain. CN = cochlear nucleus, SOC = superior olivary nucleus, IC = inferior colliculus, MGB = medial geniculate nucleus, AC = auditory cortex. (B–C) Group tonotopy maps, where low and high frequencies are shown in warm and cool colors, respectively. (B) One tonotopic gradient can be observed in human IC, running from low-to-high frequency preference in dorsolateral to ventromedial direction. (C) A mirror-symmetric low-high-low frequency gradient is present in human MGB, running in dorsomedial to ventrolateral direction. Figure panel A is adapted from Gulban et al. (2016). Figure panels B–C are adapted from Moerel et al. (2015).

