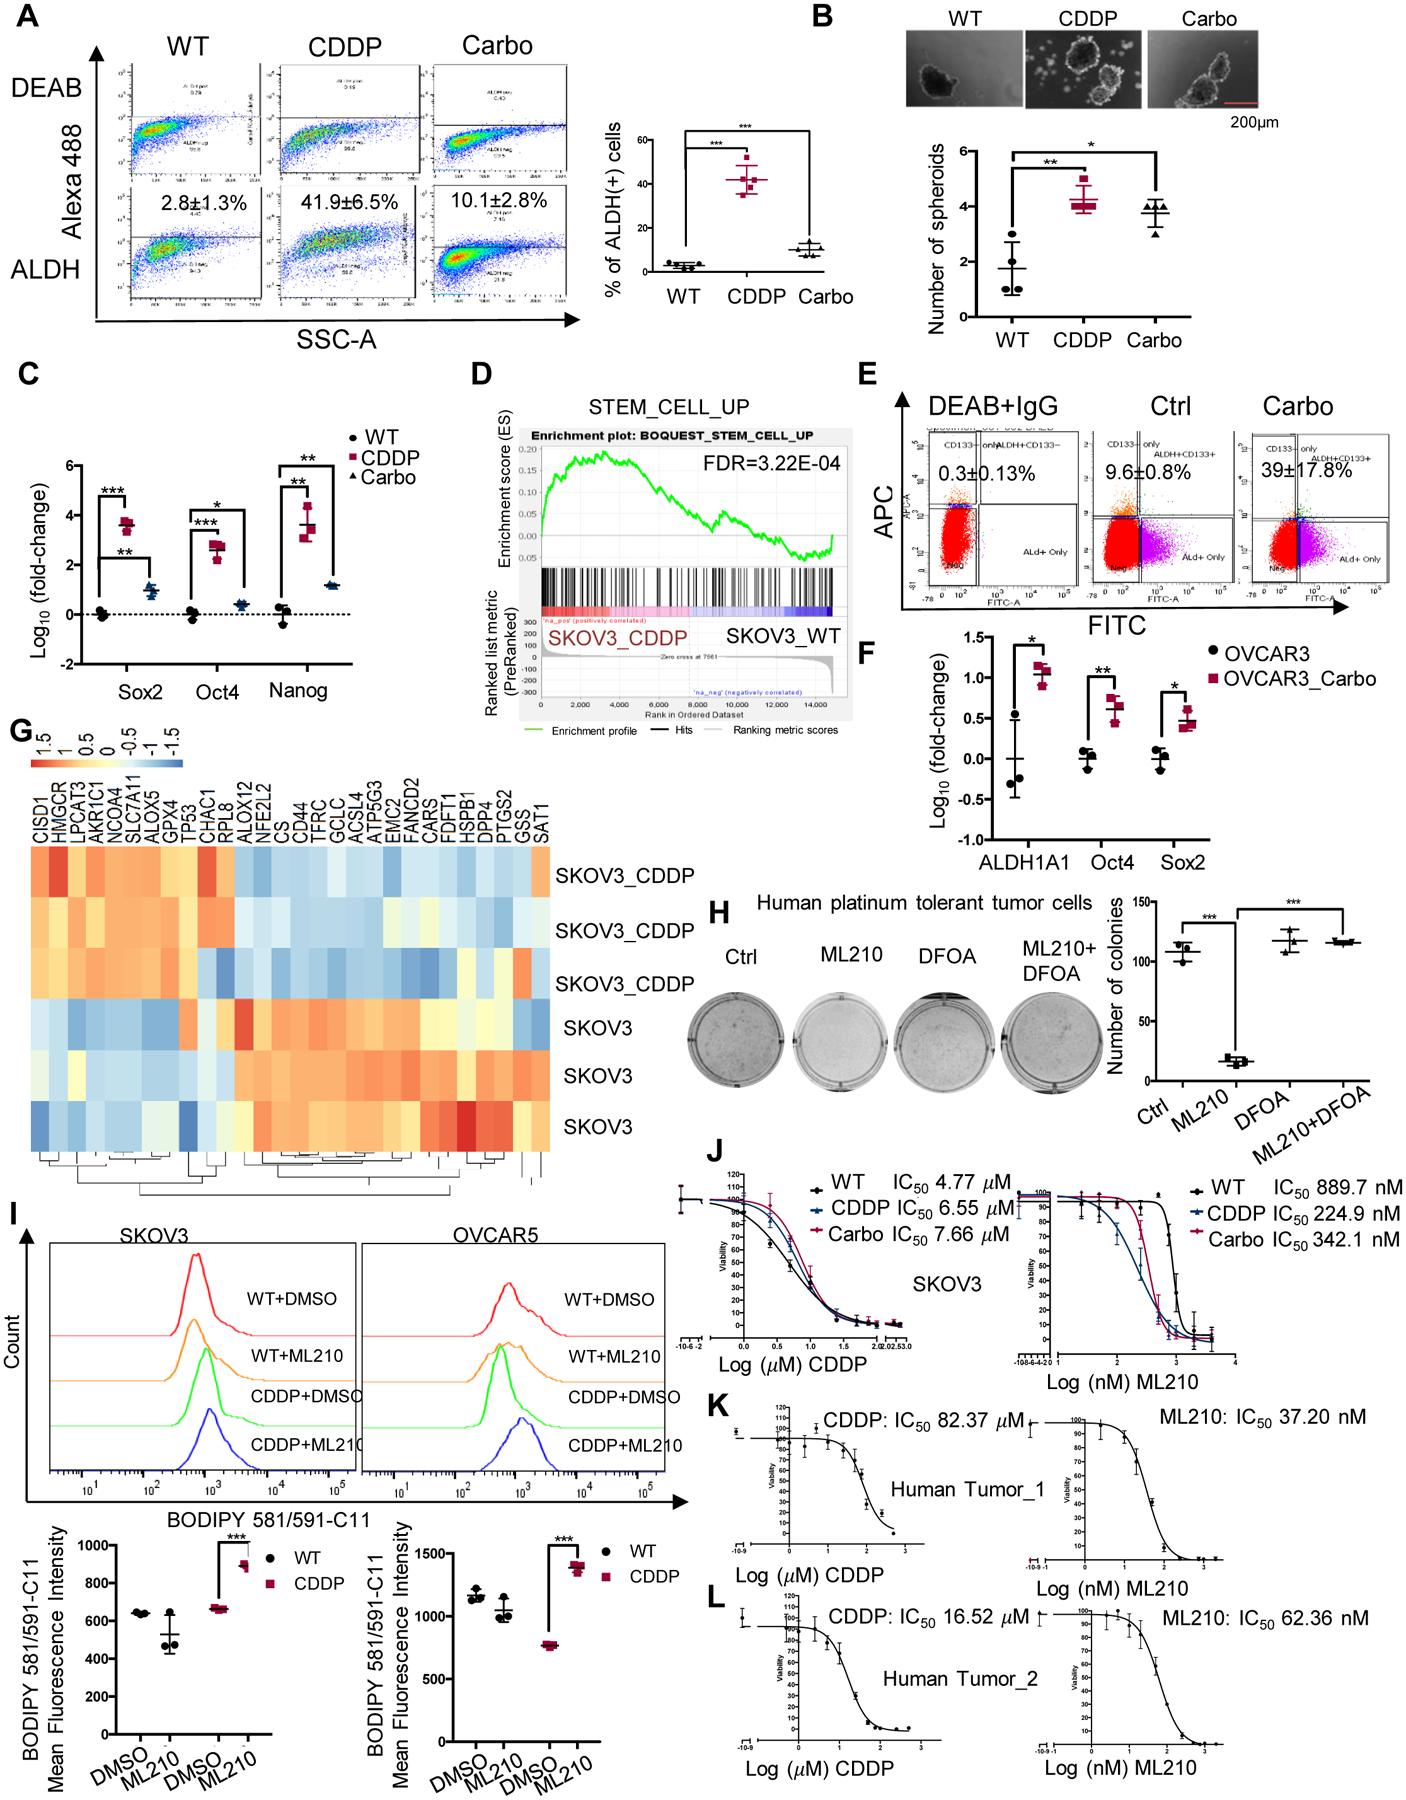
Figure 1. Stemness and ferroptosis signatures are enriched in Pt-T OC cells.

(A) Representative FACS side scatter analysis of the ALDH(+) population (left), and percentage (mean ± SD, n=5) of ALDH(+) cells (right) in parental (WT), cisplatin tolerant (CDDP), and carboplatin tolerant (Carbo) SKOV3 cells. (B) Representative images (top), and numbers (mean ± SD, n=4) of spheroids (bottom) formed by 1000 parental (WT), CDDP, and carboplatin tolerant (Carbo) SKOV3 cells after 7 days of culture under non-attachment conditions. (C) mRNA levels (fold-change ± SD, n=3) of stemness-related TFs (Sox2, Oct4 and Nanog) measured by real-time RT-PCR in CCDP and Carbo tolerant vs. parental SKOV3 cells (WT). (D) GSEA shows upregulated stemness pathway (Stem Cell_UP) in SKOV3 CDDP-tolerant vs. parental cells (FDR=3.22E-04). (E, F) FACS side scatter analysis of percentage of ALDH(+) cells (E), and fold-change (mean ± SD, n=3) ALDH1A1, Nanog, and Oct4 mRNA expression levels (F) in OVCAR3 xenografts treated with PBS (Ctrl) or carboplatin (Carbo). (G) Hierarchical clustering heatmap for DEG (FDR<0.05) ferroptosis-related genes in SKOV3_CDDP vs. control cells (n=3 replicates/group). (H) Representative pictures of a colony formation assay (left), and numbers (mean ± SD, n=3) of colonies (right) developed from 4000 cells isolated from Pt-R human tumors treated with DMSO (Ctrl), ML210 (500nM), DFOA (800nM), or ML210 plus DFOA for 24 hours. (I) Fluorescence histograms (top), and mean (± SD, n=3) fluorescence (bottom) of BODIPY 581/591-C11 staining show lipid peroxidation in SKOV3 and OVCAR5 parental (WT) cells and cisplatin tolerant (CDDP) cells treated with DMSO or ML210 (1 uM) for 20 hours. (J) Survival curves for WT, cisplatin tolerant (CDDP) and carboplatin tolerant (Carbo) SKOV3 cells in response to cisplatin (left) or GPX4 inhibitor ML210 (right). Cisplatin and ML210 IC50 values are shown. (K-L) Survival curves of cells from primary HGSOC tumors treated with cisplatin (left), or GPX4 inhibitor ML210 (right). IC50 for cisplatin and ML210 are shown. For all comparisons: *P<0.05, **P<0.01, ***P<0.001.
