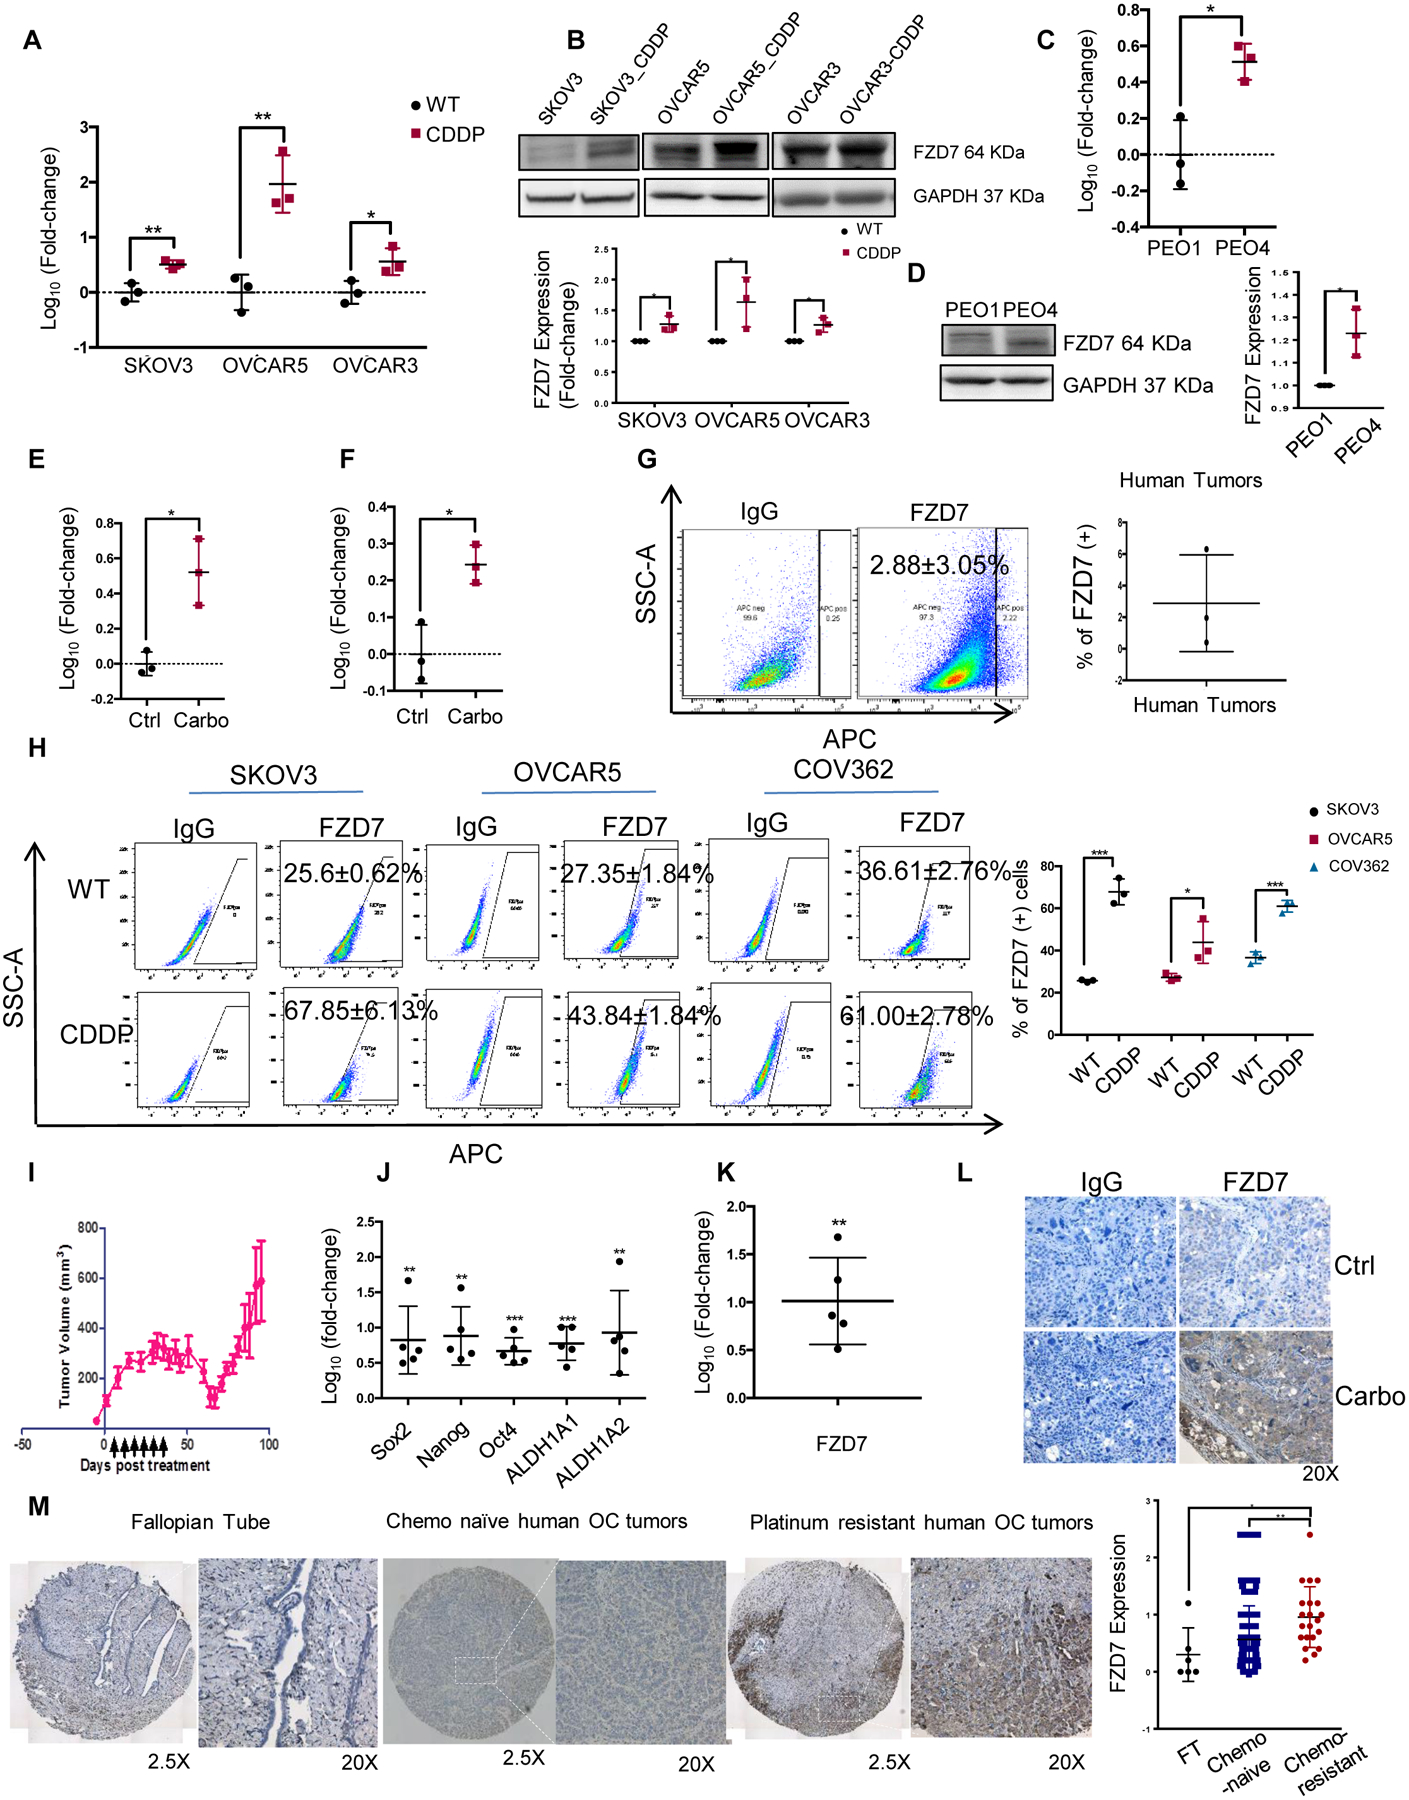
Figure 2. Frizzled 7 (FZD7) is upregulated in Pt-T OCs.

(A) Fold-change (mean ± SD, n=3) of FZD7 mRNA expression levels measured by real-time RT-PCR in cisplatin tolerant (CDDP) compared with parental OVCAR3, OVCAR5, SKOV3 cells. (B) Western blotting for FZD7 in parental and Pt-T SKOV3, OVCAR5 and OVCAR3 cells and Pt-T (-CDDP). Quantification shows fold change of FZD7 expression (n=3 experiments). (C-D) FZD7 mRNA expression levels (mean fold-change ± SD, n = 3) (C), and FZD7 protein levels measured by western blotting (D; including quantification in 3 experiments) in Pt-R PEO4 vs. PEO1 cells. (E) Fold-change (mean ± SD) of FZD7 mRNA levels in carboplatin-treated (Carbo) and control (Ctrl) SKOV3 (E) and OVCAR3 (F) xenografts (n = 3 per group). (G) FACS side scatter analysis (left) and average (±SD, n = 3) of FZD7(+) cells dissociated from HGSOC tumors. (H) FACS side scatter analysis of FZD7(+) cells (left), and percentage (mean ± SD, n=3) of FZD7(+) cells (right) in WT and Pt-T SKOV3, OVCAR5 and COV362 cells. (I) NSG mice carrying PDX received carboplatin (15mg/kg weekly) to induce platinum tolerance. Arrows indicate carboplatin treatment. Mean volumes (± SD) are shown (n=5). (J) Mean fold change (± SD, n=5) for Sox2, Nanog, Oct4, ALDH1A, and ALDH1A2 mRNA expression levels in Pt-T vs. control PDXs. (K, L) Mean fold-change of FZD7 mRNA levels (K), and representative images of FZD7 IHC staining (L) in Pt-T vs. control PDXs (Ctrl). (M) FZD7 IHC staining and H-scores (mean ± SD) (right) in sections of fallopian tube (n=6), chemo-naïve OC tumors (n=117) and Pt-T tumors (n=23) included in two tissue microarrays. For all comparisons: *P< 0.05, **P<0.01, and ***P<0.001.
