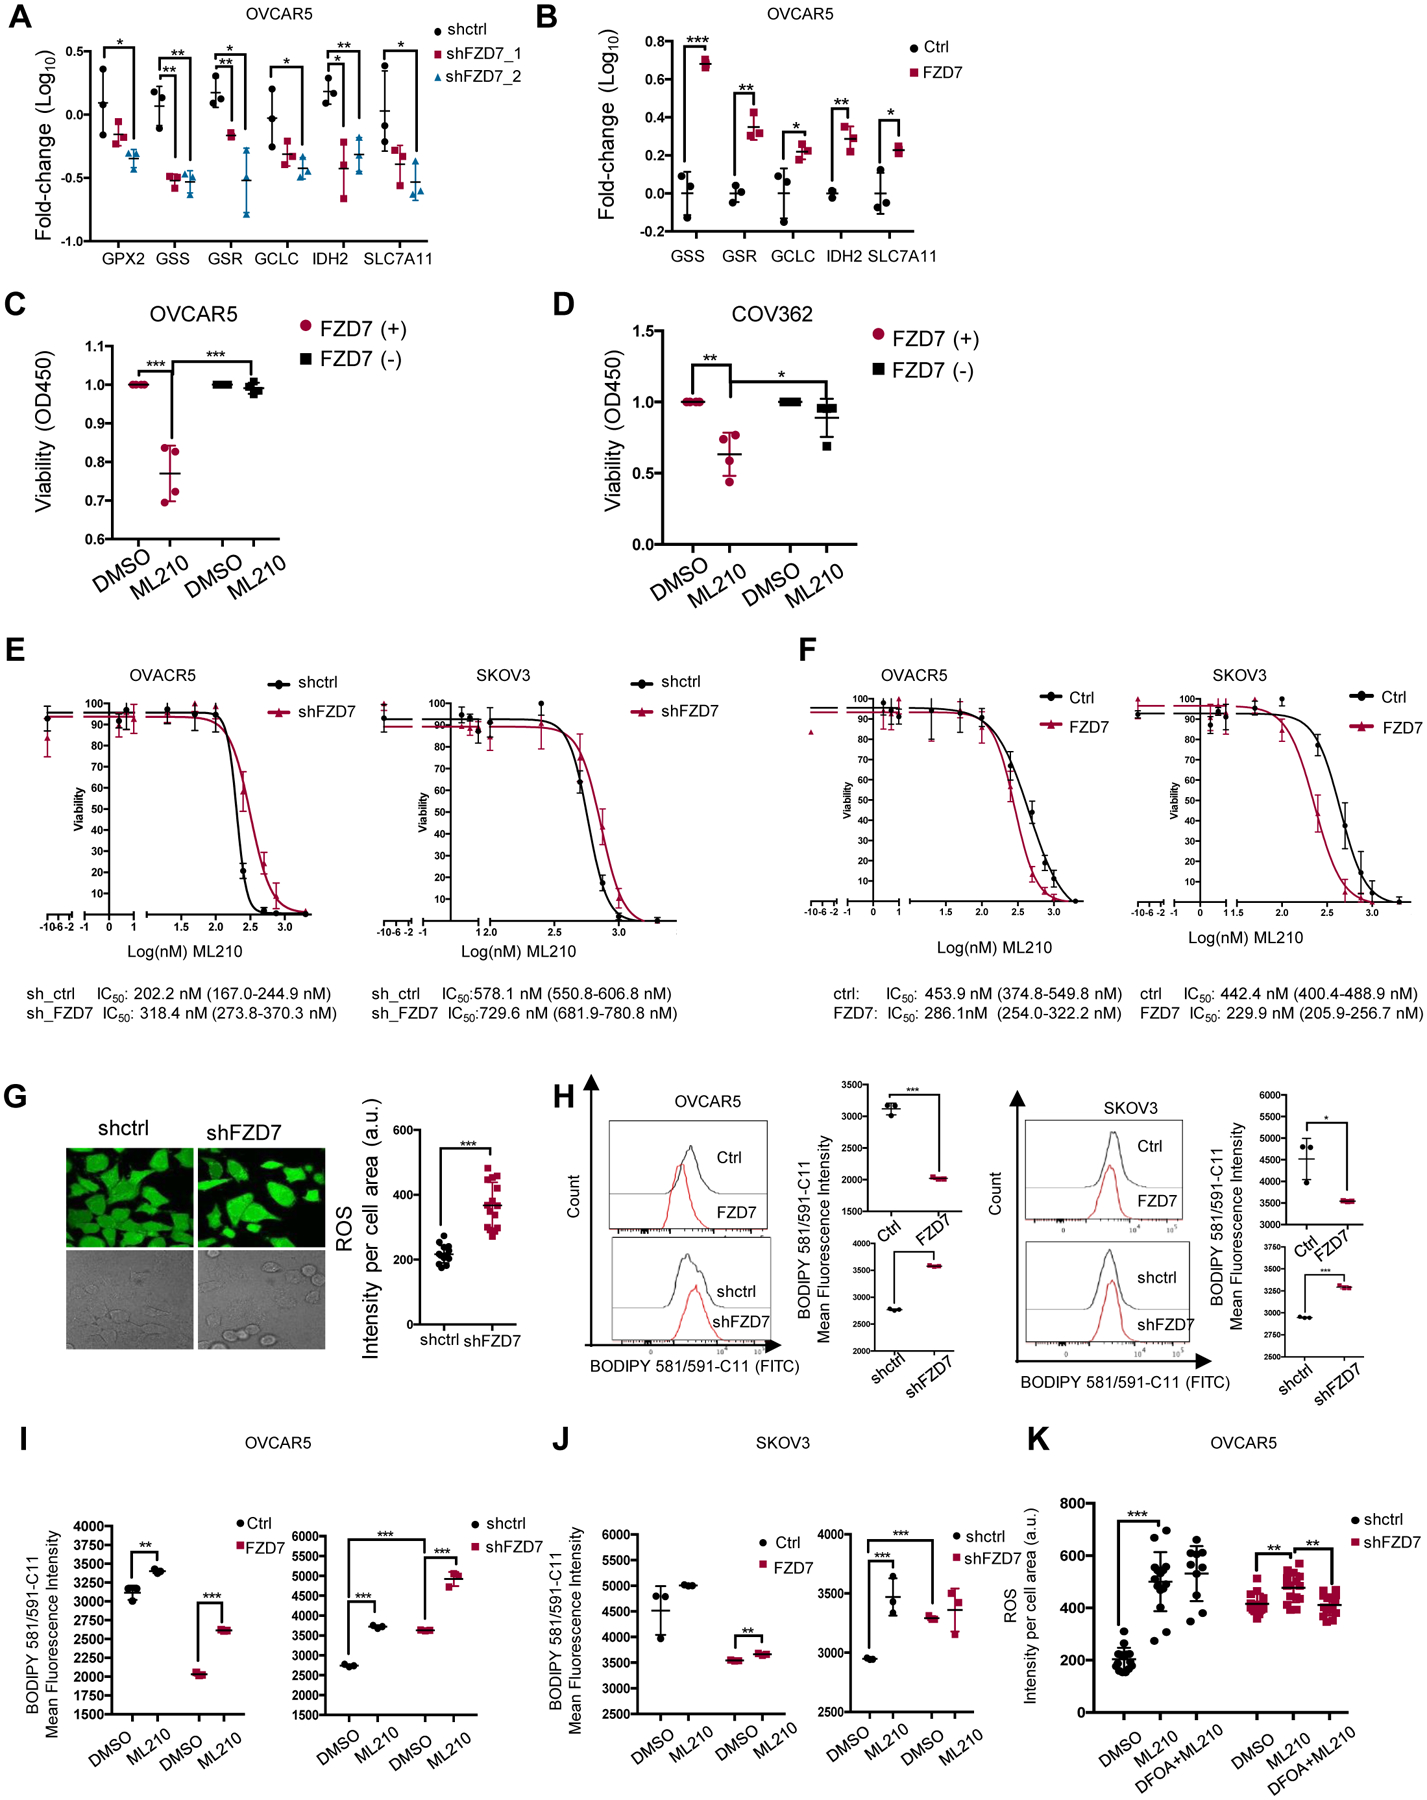
Figure 6. FZD7 marks a cell population susceptible to GPX4 inhibitors.

(A) Average fold-change (±SD, n = 3) in mRNA expression levels of selected glutathione metabolism genes in OVCAR5 cells transduced with shRNAs targeting FZD7(shFZD7) vs. control shRNA (A), and in OVCAR5 cells transfected with FZD7-pcDNA3.1 (FZD7) vs. control vector (Ctrl) (B) (C-D) Viability of FZD7(+) and FZD7(−) cells sorted from OVCAR5 and COV362 (D) cells and treated with DMSO or ML210 (OVCAR5, 2μM; COV362, 1μM) for 72 hours. Data are presented as average fold-change (± SD, n = 4) of absorbance values relative to control. (E) Survival curves of OVCAR5 (left) and SKOV3 (right) cells transduced with control shRNAs (shctrl) or shRNAs targeting FZD7 (shFZD7) and treated with ML210 for 3 days (n=3–4). ML210 IC50 values are shown below. (F) Survival curves of OVCAR5 (left) and SKOV3 (right) cells transfected with FZD7-pcDNA3.1 or control vector and treated with ML210 for 3 days. ML210 IC50 values are shown below (n=3–4). (G) Images (left) and quantification of intracellular ROS levels (right) in OVCAR5 cells transfected with control shRNA (shctrl) or shRNA targeting FZD7 (shFZD7). Data are presented as means (± SD) of DCF fluorescence intensity per cell area (n = 15). (H) Histograms of fluorescence intensity (left) and mean (± SD, n = 3) (right) of BODIPY 581/591-C11 in OVCAR5 (left) and SKOV3 (right) cells transfected with vector (ctrl), FZD7-pCDNA3.1 (FZD7), control shRNA (shctrl), or shRNAs targeting FZD7 (shFZD7). (I, J) Mean (± SD, n=3) fluorescence intensity of BODIPY 581/591-C11 show effects of ML210 (1 μM for 20 hours) on lipid peroxidation levels in SKOV3 (I) and OVCAR5 (J) cells transfected with empty vector (ctrl), FZD7-pcDNA3.1 (FZD7), control shRNA (shctrl), or shRNA against FZD7 (shFZD7). (K) Intracellular ROS levels in OVCAR5 cells transfected with shctrl and shFZD7 treated with DMSO, ML210 (2μM, 24 hours) and ML210 + DFOA (800nM, 24 hours) measured by assessing DCFHDA oxidation. Average intensity per cell area (± SD) is shown (n=15). For all comparisons: *P<0.05, **P<0.01, ***P<0.001.
