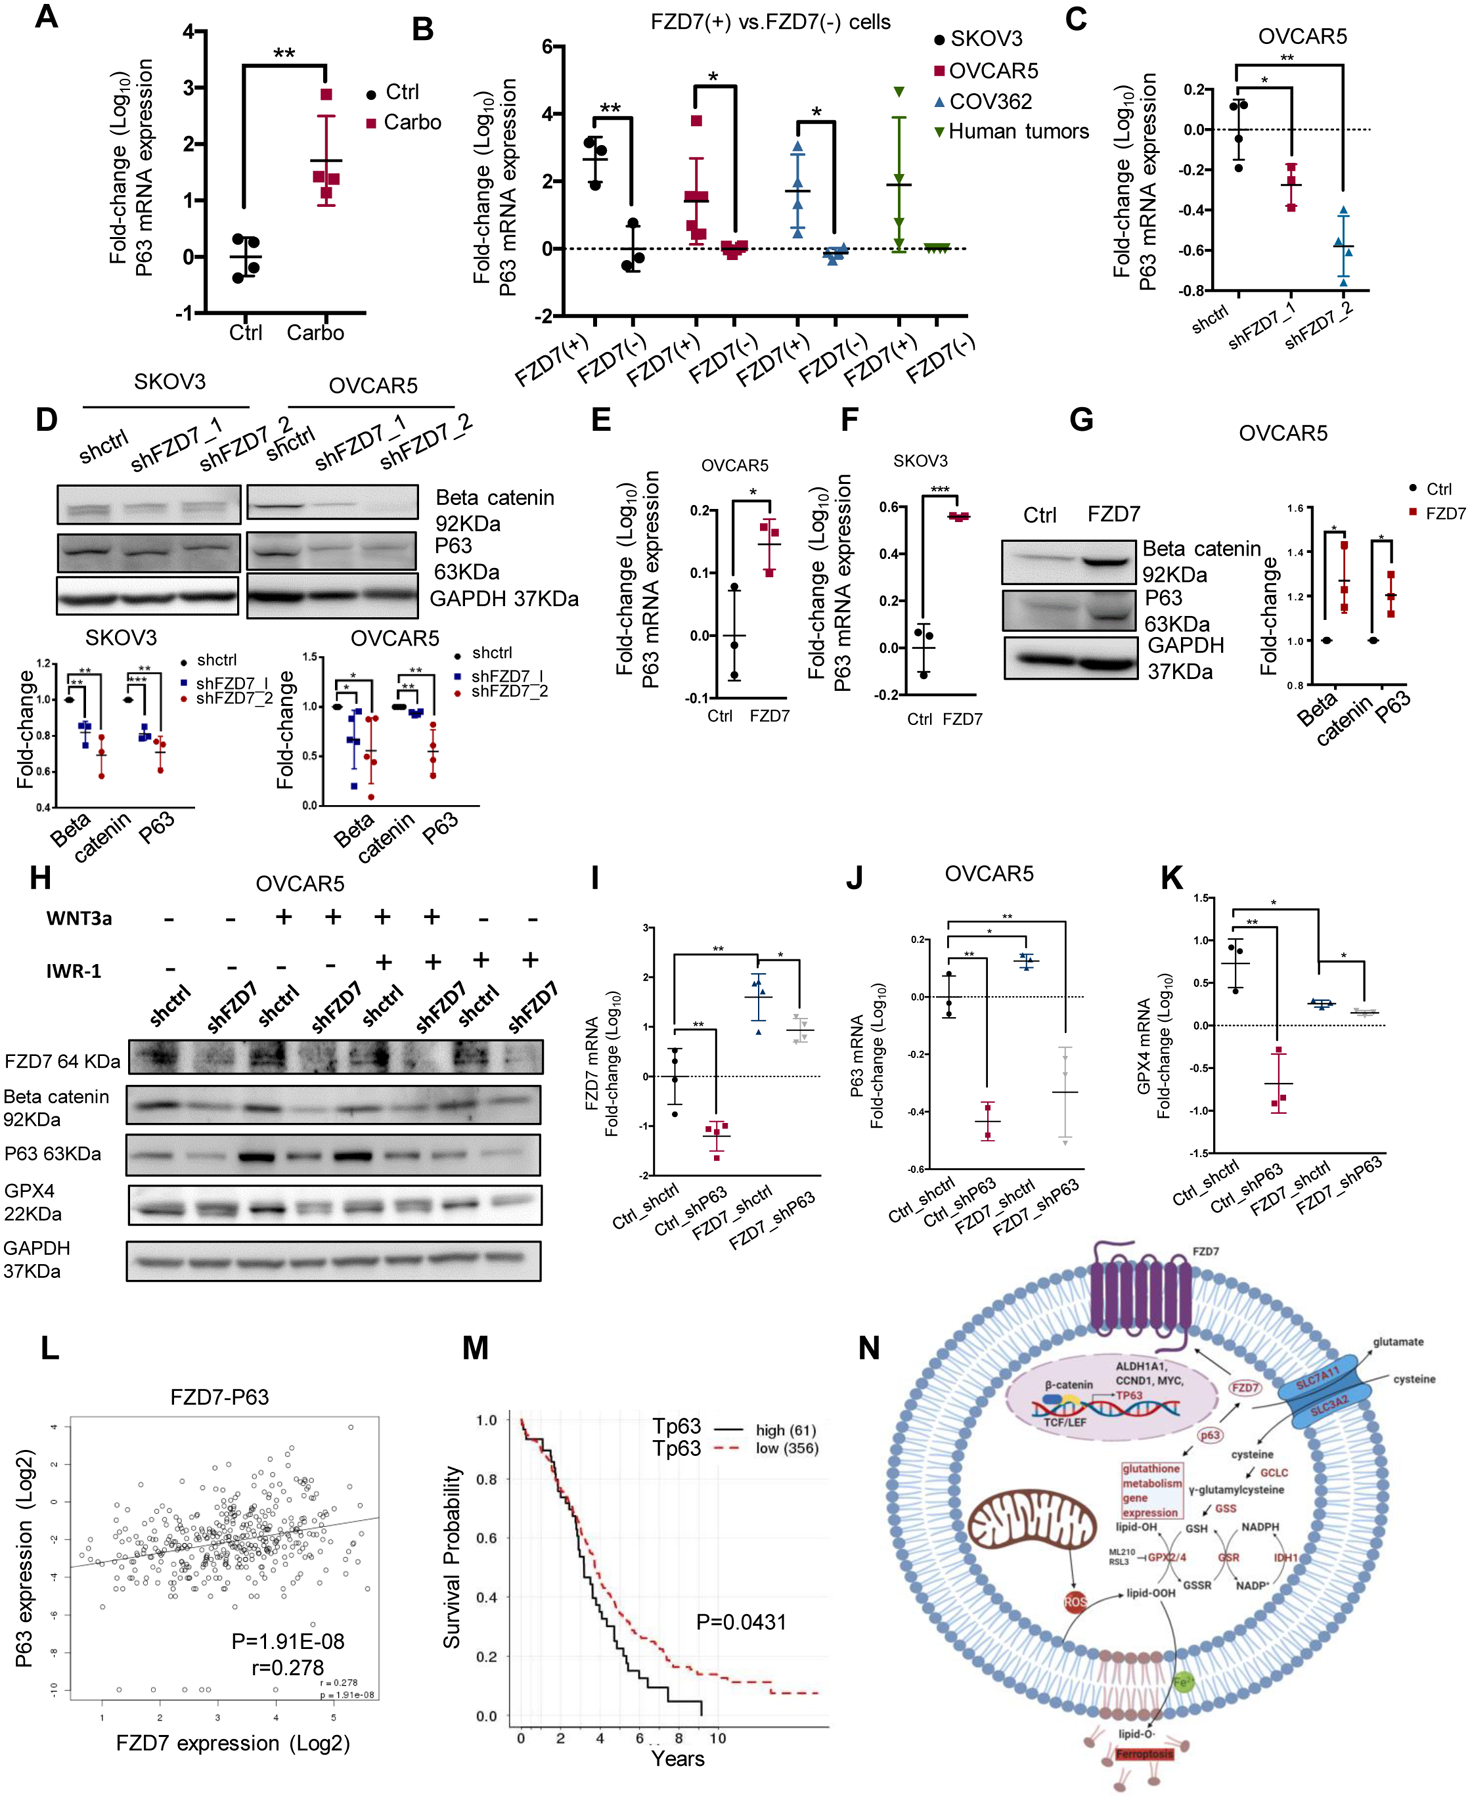
Figure 7. FZD7 regulates GPX4 expression and gluthatione metabolism by activating the canonical β catenin/p63 pathway.

(A) P63 mRNA levels (fold-change ± SD, n=4) in Pt-T PDXs (carbo) vs. controls (Ctrl). (B) P63 mRNA levels (fold-change ± SD, n=3–6) in FZD7(+) versus FZD7(−)cells sorted from SKOV3, OVCAR5, and COV362 cell lines, and cell suspensions from human tumors. (C) P63 mRNA expression levels (fold-change ± SD, n = 4) in OVCAR5 cells transduced with shRNAs targeting FZD7 (shFZD7) vs. control shRNA (shctrl). (D) Western blot for β-catenin, P63, and GAPDH in SKOV3 and OVCAR5 cells transduced with shRNAs targeting FZD7 (shFZD7) or control shRNA (shctrl). Quantification shows fold change of β-catenin and P63 expression across 3 experiments. (E, F) P63 mRNA levels (fold-change ± SD, n=3) in OVCAR5 (E) and SKOV3 (F) cells transfected with FZD7 vs. control vector (Ctrl). (G) Western blot for β-catenin, P63, and GAPDH in OVCAR5 cells transfected with control (ctrl) or FZD7-pcDNA3.1 (FZD7). Quantification shows fold change of β-catenin and P63 expression across 3 experiments. (H) Western blot for FZD7, β-catenin, P63, GPX4 and GAPDH in OVCAR5 cells transfected with shctrl, shFZD7 (J) treated with WNT3a (150ng/ul) and/or IWR-1-endo (1 μM) for 24 hours (n = 2). (I-K) FZD7(I), P63 (J), and GPX4 (K) mRNA expression levels (fold-change ± SD, n=3–4) in OVCAR5 cells transduced with control shRNAs (Ctrl_shctrl, Ctrl_shP63, FZD7_shctrl) or transfected with FZD7 expression vector and subsequently transduced with shRNA targeting P63 (FZD7_shP63). For all comparisons: *P<0.05, **P<0.01, ***P<0.001. (L) Scatter plot shows the correlation between P63 and FZD7 mRNA expression levels in HGSOC tumors (n=419) profiled in the TCGA database. Pearson correlation coefficients and P-values are shown. (M) Kaplan-Meier survival curves for HGSOC patients profiled in the TCGA having high (n=61) or low (n=318) P63 (TP63-012) mRNA expression levels. High or low levels were defined based on statistically determined cutoff point that maximizes absolute value of the standardized two-sample linear rank statistic. (N) Model demonstrates the proposed mechanism by which FZD7 engages the anti-oxidant pathway governed by GPX4.
