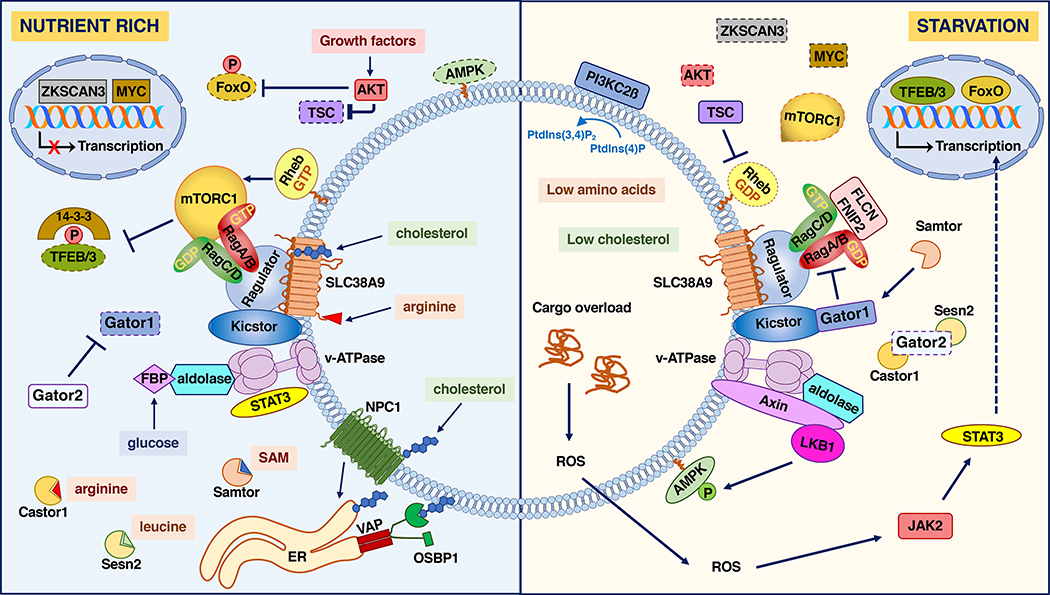
Figure 1. Metabolic regulation in lysosomes.
Scheme of the different signaling pathways assembled on the lysosome surface in response to variations in the levels of amino acids, glucose, growth factors and cholesterol. Multiple nutrient signals, including glucose, amino acids and cholesterol converge to regulate the activity of Rag GTPases. When the levels of these nutrients are elevated (left panel), Rag GTPases activate, promoting the recruitment of the mTORC1 complex to the lysosome surface. At the same time, high levels of growth factors cause displacement of the TSC complex from the lysosomal surface, preventing its GAP activity towards Rheb. GTP-bound Rheb then promotes mTORC1 activation. A number of sensors, including Castor, Sestrin2 and Samtor, detect variations in the cytosolic pool of amino acids, whereas the lysosomal amino acid permease SLC38A9 recognizes amino acid concentration, in particular arginine, inside the lysosome lumen. Cholesterol transfer from the endoplasmic reticulum (ER) to the lysosomal membrane via OSBP1 also favors mTORC1 activation. Active mTORC1 phosphorylates members of the MiT/TFE family of transcription factors, such as TFEB and TFE3, promoting their binding to 14-3-3 and consequent cytosolic sequestration. At the same time, active AKT promotes autophagy inhibition through phosphorylation and inactivation of beclin and FoxO transcription factors. When the nutrients are scarce (right panel), GATOR1 is recruited to lysosomes inducing GDP-loading of RagA/B and inactivation of mTORC1. This allows translocation of TFEB and TFE3 to the nucleus to induce expression of multiple genes implicated in lysosomal biogenesis, autophagy, and metabolic regulation. The autophagic/lysosomal axis is also modulated by activation of FoxO and STAT3. Low glucose levels, results in recruitment of Axin-LKB1 to lysosomes and activation of AMPK, which balance energy homeostasis by promoting catabolic processed to restore ATP levels. Dashed lines indicate inactivation; P inside a red circle represents inhibitory phosphorylation, P inside a green circle represents activating phosphorylation.

