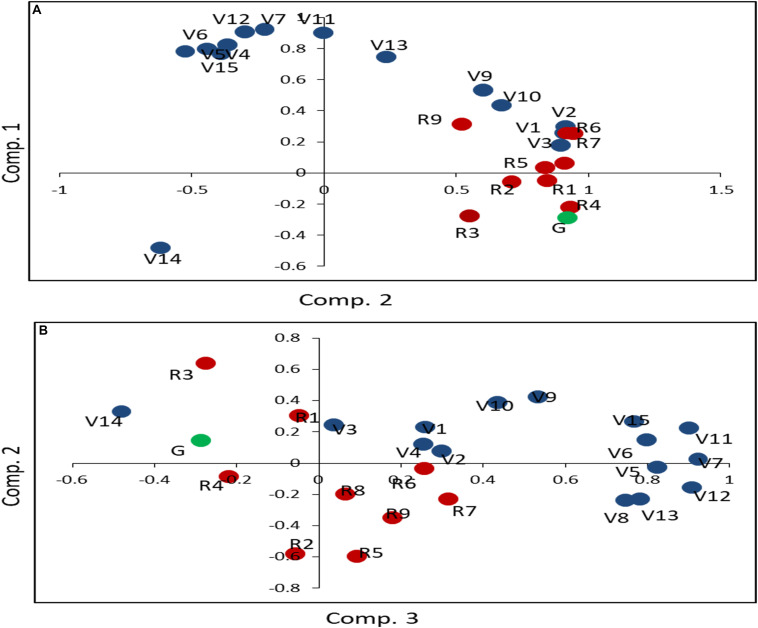
FIGURE 2.
Principal component analysis of the effect of N on 25 phenotypic parameters in five rice genotypes. The mean values of 32 replicates for normal and low urea treatments were transformed using (X-mean)/STD and taken together for all five genotypes for principal component analysis. As the first three components accounted for 85% of the variance, plots of the principal component 1 vs. 2 (A) and 2 vs. 3 (B) have been shown. The parameters have been grouped and color-coded as related to germination (green) vegetative (blue) and reproductive (red) growth to denote: chlorophyll (V1), green leaf number at vegetative stage (V2), yellow leaf number at vegetative stage (V3), total leaf number at vegetative stage (V4), leaf width (V5), stem thickness (V6), shoot length before harvest (V7), total leaf number at flowering (V8), green leaf number at flowering (V9), yellow leaf number at flowering (V10), fresh biomass (V11), shoot length after harvest (V12), root length (V13), total plant height (V14), dry weight of plant (V15), flowering (R1), unfilled grain weight (R2), total grain weight (R3), filled grain weight (R4), panicle weight (R5), filled grain number (R6), total grain number (R7), unfilled grain number (R8), weight of panicle remains (R9). The segregation of these groups as apparent in these plots for urea treatment has also been found in nitrate treatment (data not shown).

