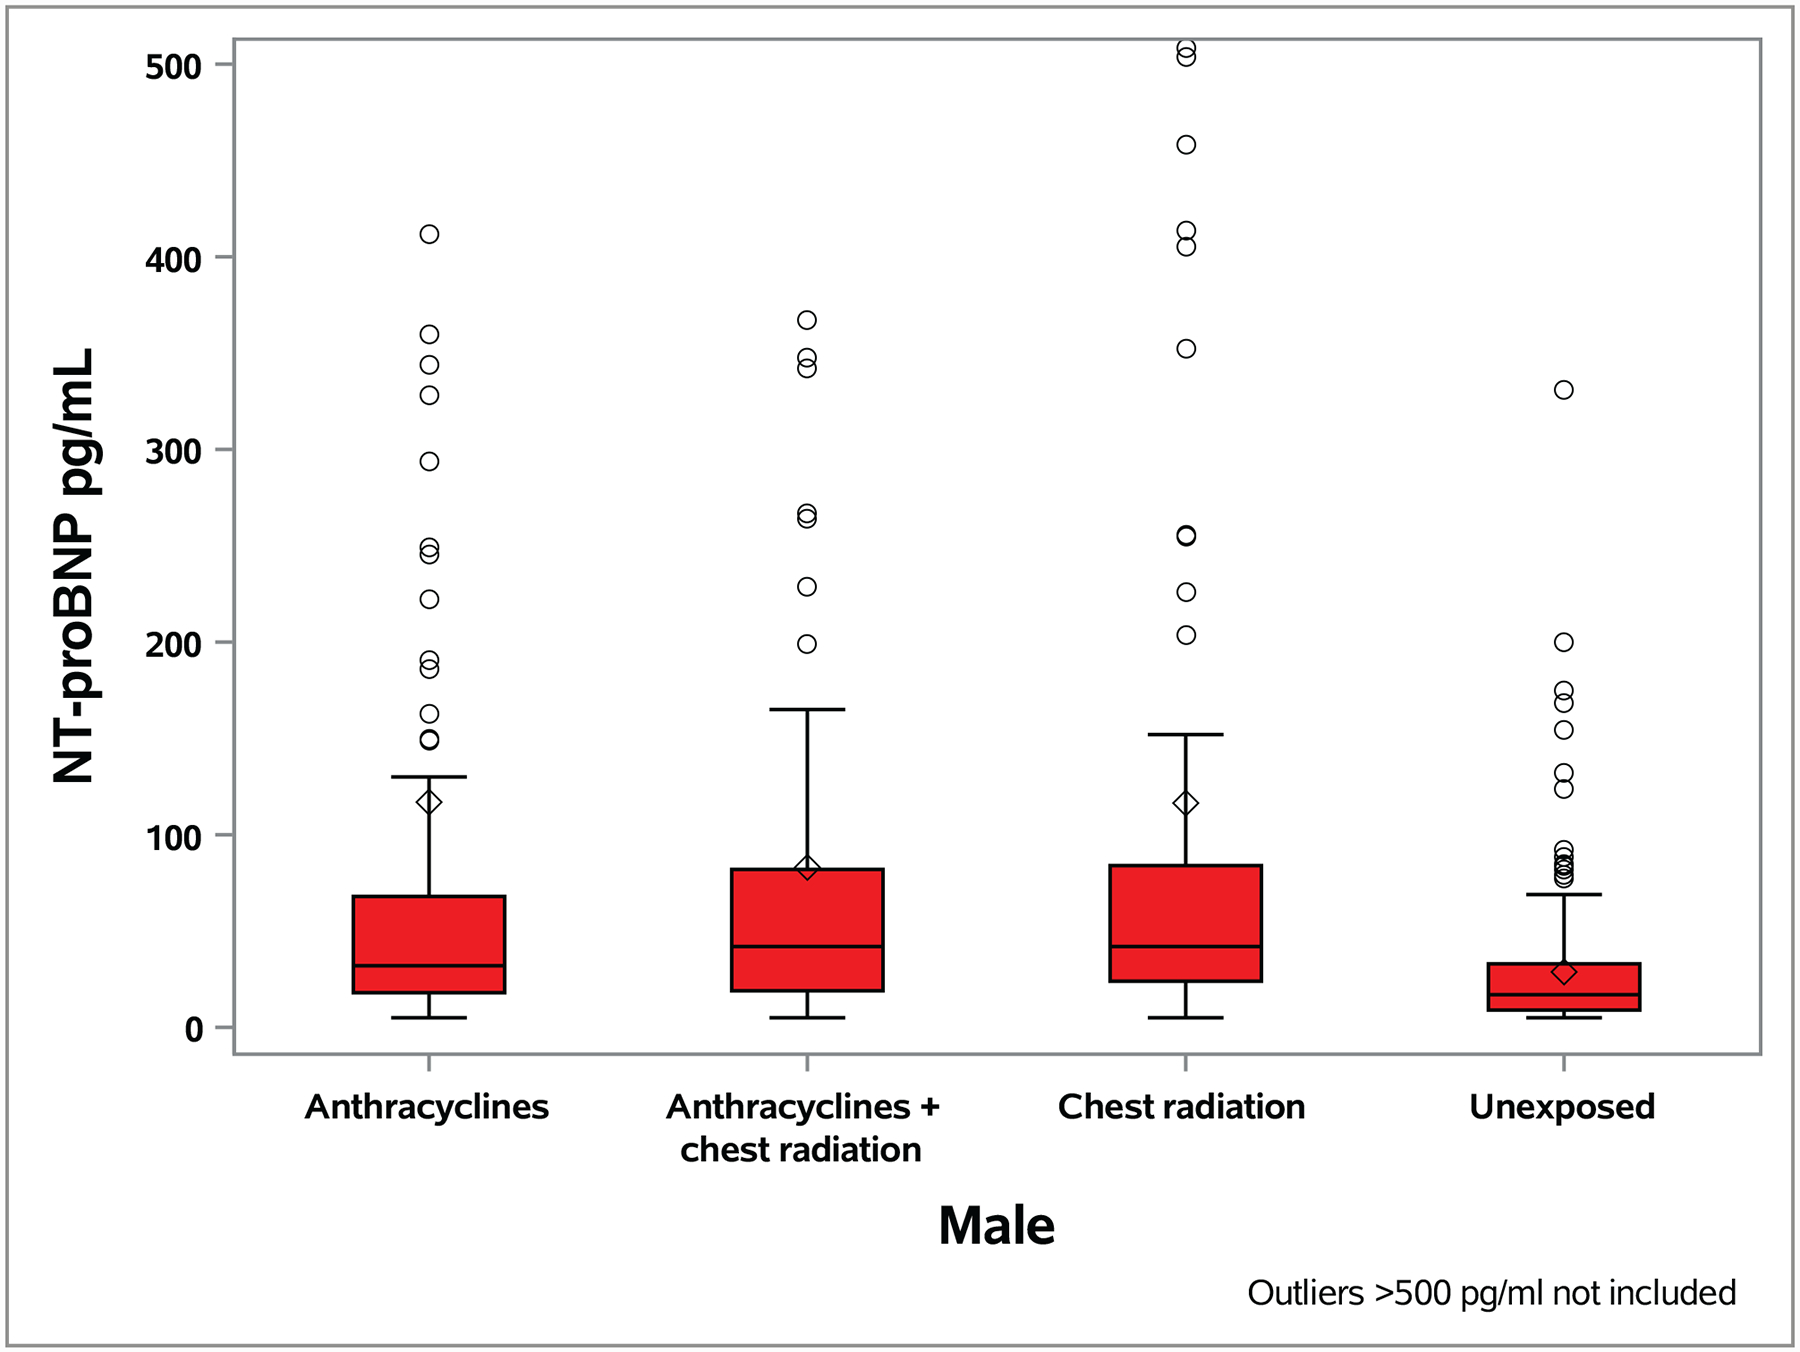
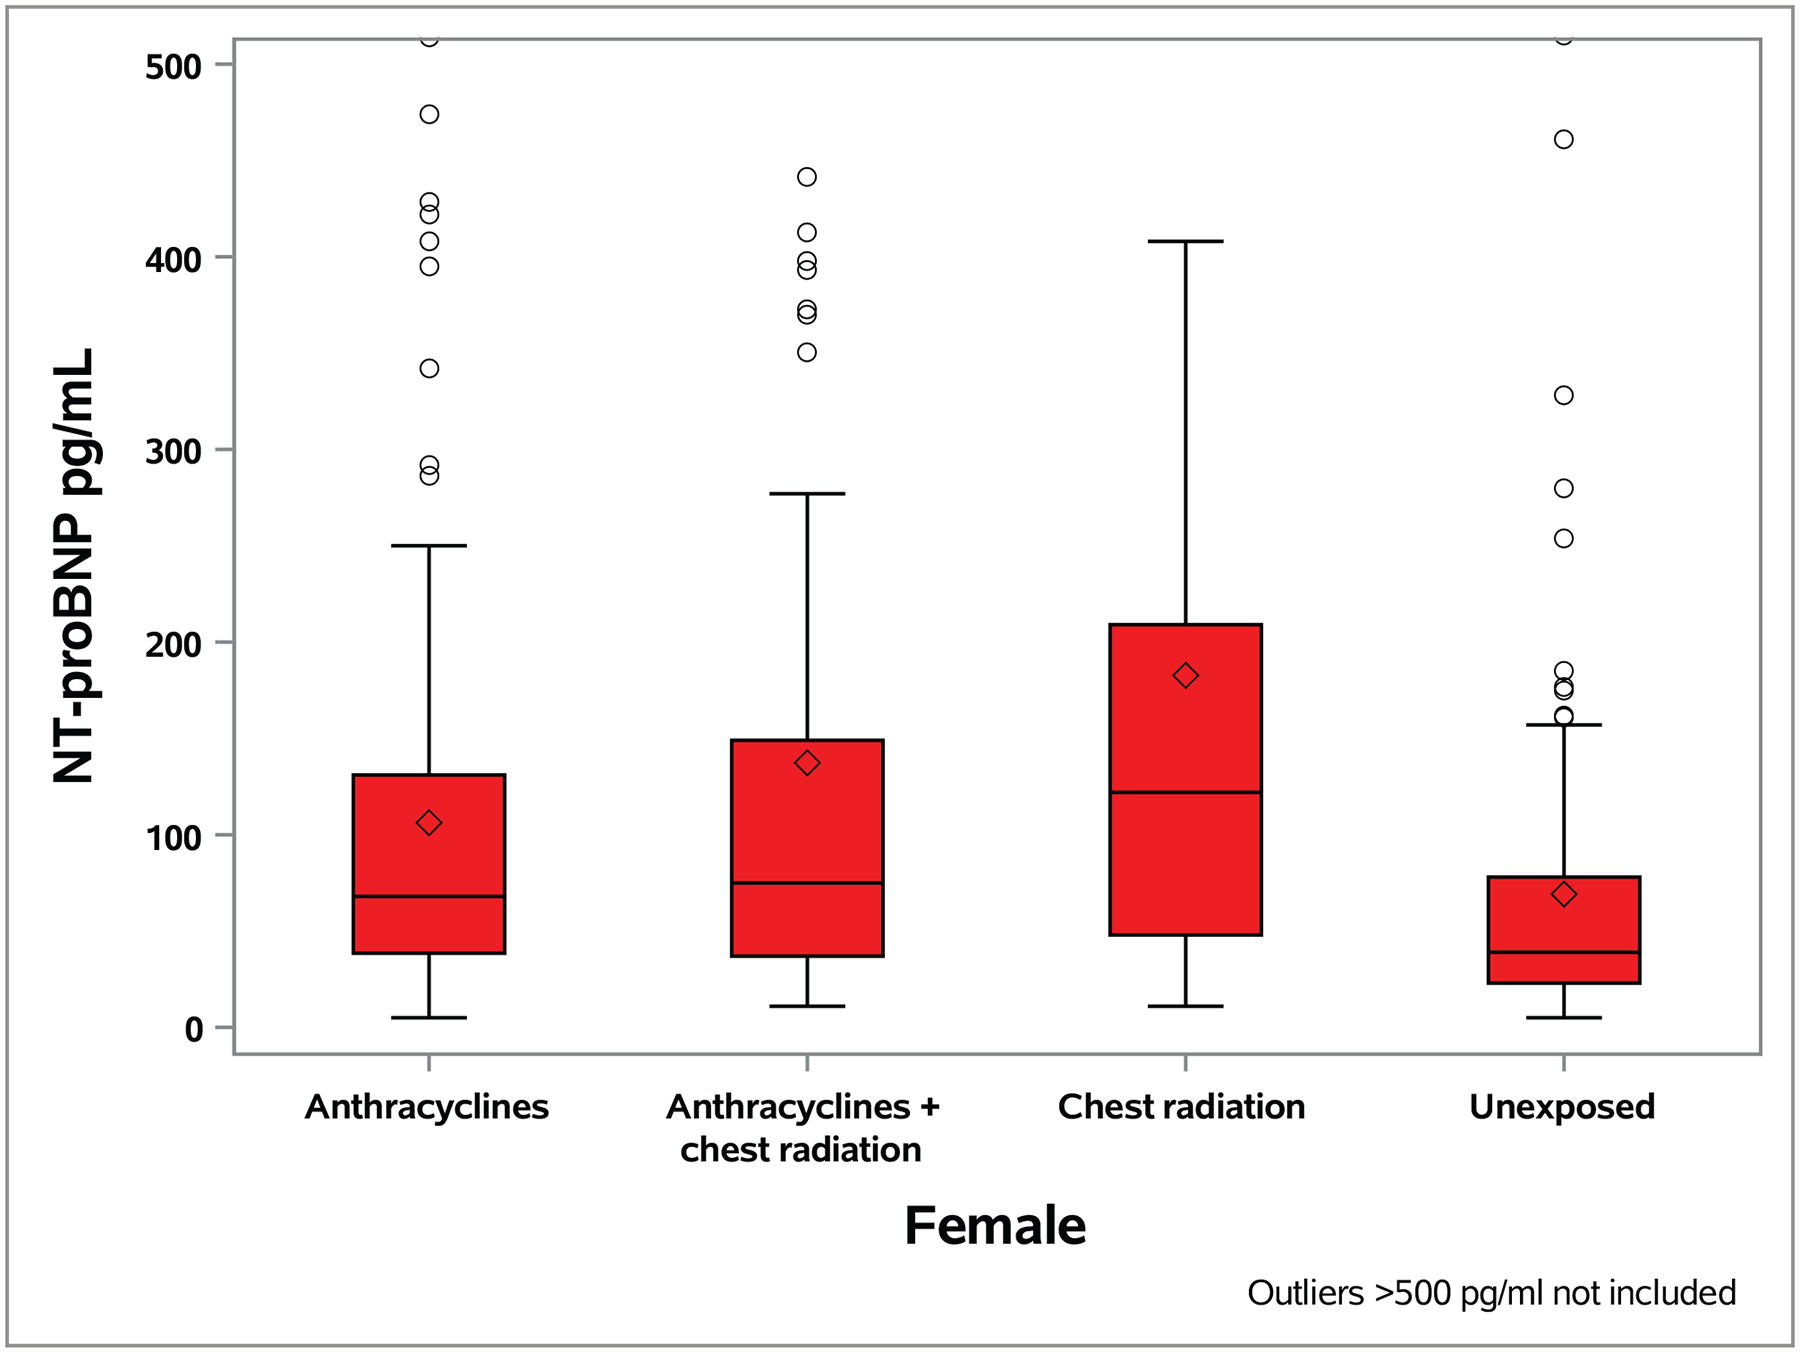
Figure 1. Distribution of NT-proBNP level by anthracycline and chest radiation therapy exposure status and sex.


The median value is represented by the horizontal line within each box, the box is the interquartile range and the whiskers extend to 1.5 times the interquartile range. Circles represent outliers and the diamond represents the mean value
