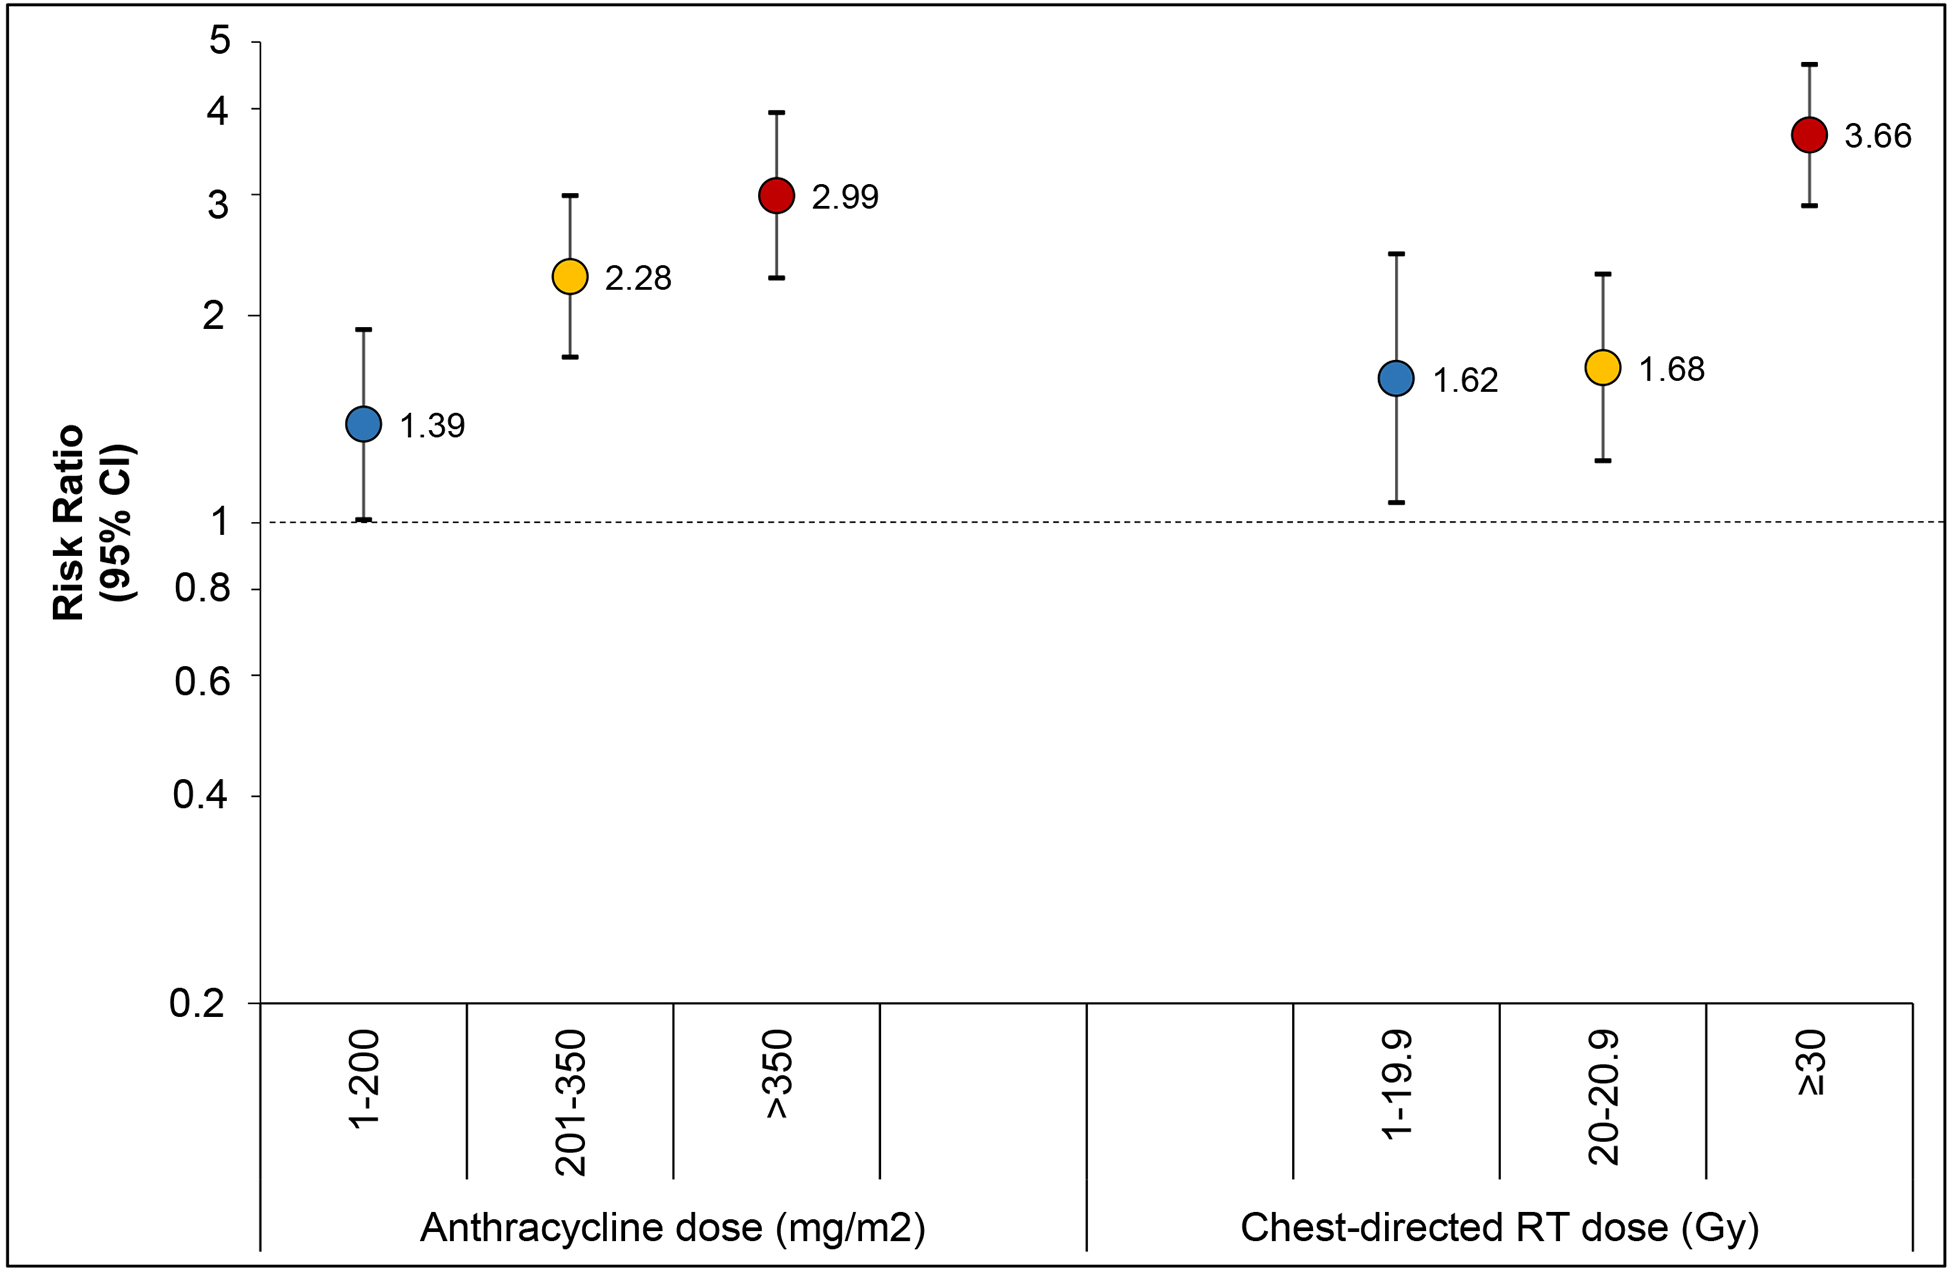
Figure 2. Multivariable association between treatment exposures and abnormal NT-proBNP as risk ratio (95% confidence interval).

Analysis modeled the risk ratio of abnormal NT-proBNP adjusting for age at diagnosis, attained age, race, sex and treatment exposures in figure. Risk ratios for each treatment are compared to no exposure to that treatment, represented by the line of no difference at a risk ratio of 1.0.
