
FIGURE 6.
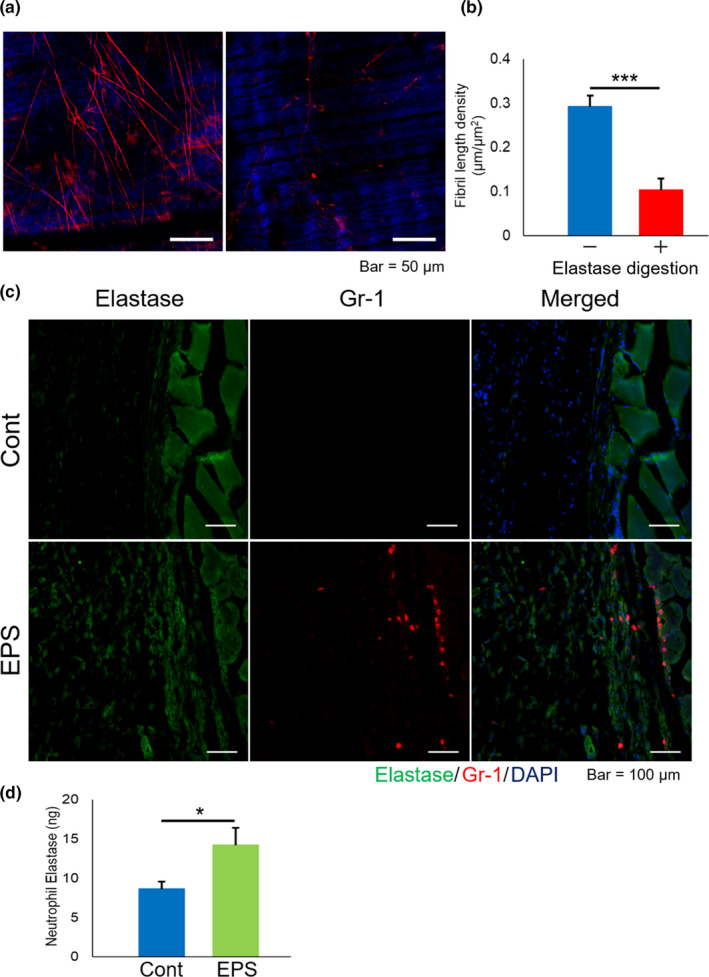
Elastolytic susceptibility of EBD‐labelled fibrils and possible involvement of neutrophil elastase in fibril remodelling of myofascia. (a) Representative TPM images and (b) length density of EBD‐labelled fibrils in TA myofascia before and after elastase digestion (n = 6). (c) Representative IHC images of mouse TA tissue with or without electrical pulse stimulation (EPS), indicating elastase (green), Gr‐1 (red), and DAPI (blue). (d) Neutrophil elastase (ELANE) activity between control TA and EPS‐treated TA. Data in graph are represented as mean ± SE, and statistical significance was analysed with paired t‐test, in which * and *** indicate p < 0.05 and <0.001, respectively