
FIGURE 3.
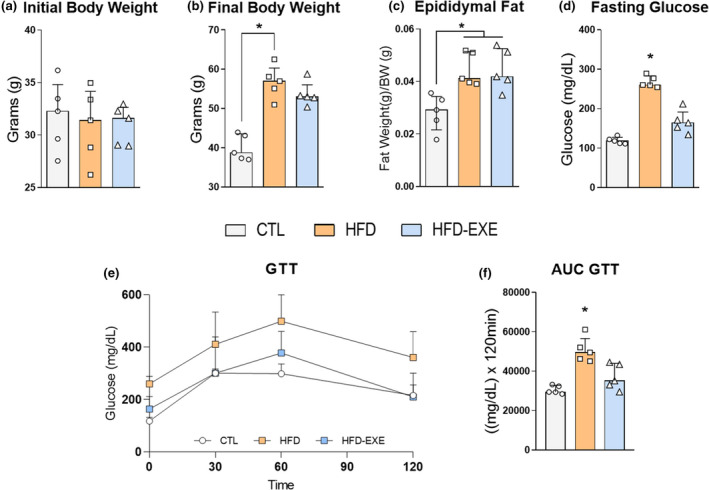
Physiological parameters (CTL n = 5, HFD n = 5, HFD‐EXE n = 5). (a) Initial body weight. (b) Final body weight. (c) Epididymal fat mass. (d) Fasting glucose. (e) Glucose tolerance test. (f) AUC GTT. The bar charts represent the median and IQR of each experimental group. *p < 0.05 HFD vs. CTL, #p < 0.05 HFD‐EXE vs. HFD