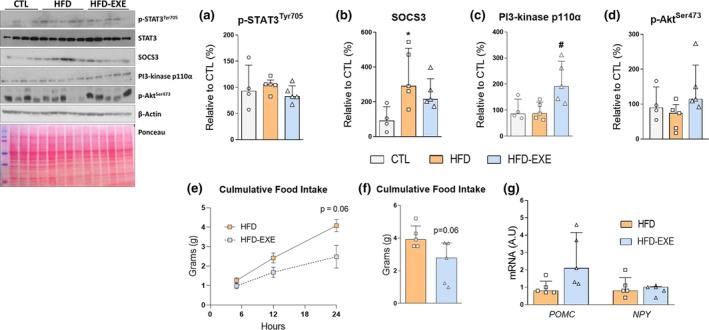
FIGURE 4.

Molecular analysis (CTL n = 4, HFD n = 5, HFD‐EXE n = 5) and energy intake assessment (HFD n = 5, HFD‐EXE n = 5) after leptin stimulation. (a) p‐STAT3 Tyr705/STAT3 (b) SOCS3/β‐Actin, (c) PI3‐kinase p110α/β‐Actin and (d) p‐Aktser473/β‐Actin. (e) Cumulative food intake at 5, 12 and 24 h. (f) Total cumulative food intake for 24 h. (g) mRNA levels of hypothalamic POMC and NPY. The bar charts represent the median and IQR of each experimental group. *p < 0.05 HFD vs. CTL, #p < 0.05 HFD‐EXE vs. HFD
