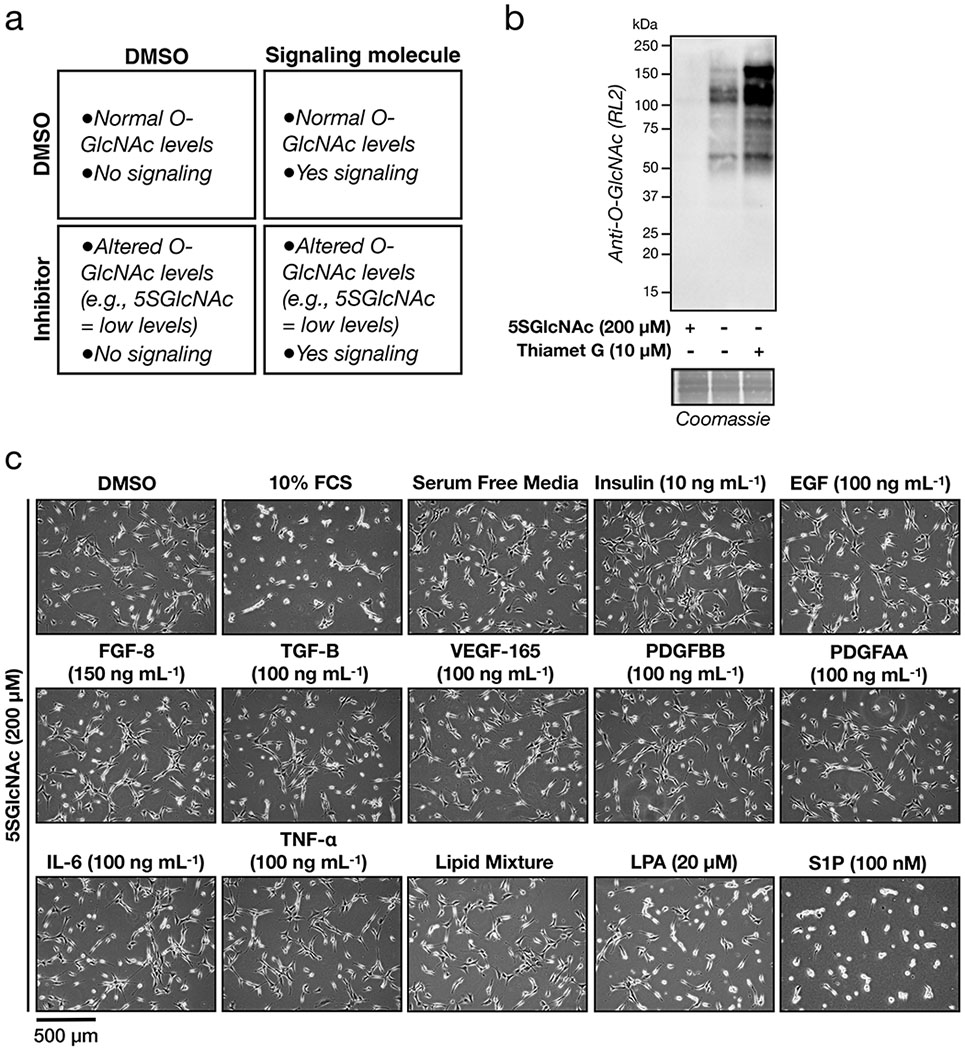
Extended Data Figure 1. Modulating O-GlcNAcylation levels and identification of S1P.

a) Schematic layout of our general experimental conditions. b) O-GlcNAc levels can be changed upon OGT or OGA inhibition. NIH3T3 cells were treated with either the OGT inhibitor 5SGlcNAc, the OGA inhibitor Thiamet G, or DMSO vehicle respectively before the O-GlcNAc levels were analyzed by Western blotting. c) Only serum- or S1P-treatment results in notable cell contraction when O-GlcNAc levels have been lowered. NIH3T3 cells were treated with DMSO or 5SGlcNAc. The indicated signaling molecules were then added, and the contraction phenotype was then visualized using bright-field microscopy. The data in b-c is representative of 2 biological replicates.
