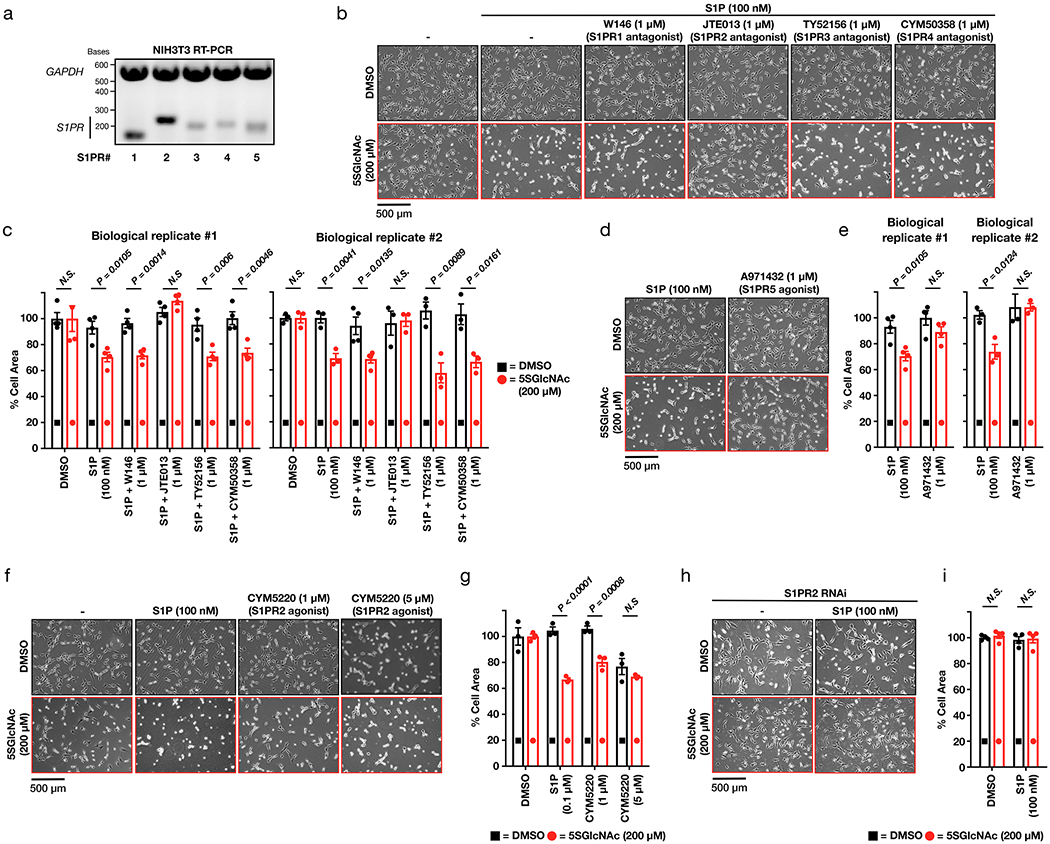
Extended Data Figure 3. Signaling through the second S1P receptor, S1PR2, is responsible for the contraction phenotype.

a) NIH3T3 cells can express all five S1P GPCRs (S1PR1 to 5). mRNA was collected from NIH3T3 cells before being subjected to RT-PCR and visualization on an DNA-agarose gel. These data are representative of 2 biological replicates. b) Antagonizing S1PR2, but not the other receptors, inhibits S1P-mediated cell contraction. NIH3T3 cells were treated with either DMSO or 5SGlcNAc. The same cells were then treated with either additional DMSO or the indicated selective antagonists followed by S1P. The contraction phenotype was then visualized using bright-field microscopy. c) Quantitation of the data in (b). Results are the mean ± SEM of the relative culture plate area taken-up by cells in at least three randomly selected frames. Statistical significance was determined using a 2-tailed student’s t-test. d) S1PR5 agonism does not induce cell contraction. NIH3T3 cells were treated with either DMSO or 5SGlcNAc. The same cells were then treated with either S1P or the S1PR5-selective agonist A971432. The contraction phenotype was then visualized using bright-field microscopy. e) Quantitation of the data in (d). Results are the mean ± SEM of the relative culture plate area taken-up by cells in at least three randomly selected frames. Statistical significance was determined using a 2-tailed student’s t-test. f) Lowering O-GlcNAc levels increases the sensitivity of NIH3T3 cells to S1PR2 induced cell contraction. NIH3T3 cells were treated with either DMSO or 5SGlcNAc before addition of the indicated concentrations of the S1PR2-selective agonist CYM5220. The contraction phenotype was then visualized using bright-field microscopy. g) Quantitation of the data in (f). Results are the mean ± SEM of the relative culture plate area taken-up by cells in four randomly selected frames. Statistical significance was determined using a 2-way ANOVA test followed by Sidak’s multiple comparisons test. h) S1PR2 knockdown using siRNA blocks contraction phenotype. NIH3T3 cells were transfected with either scramble or S1Pr2-targeted RNAi before addition of DMSO or S1P. The contraction phenotype was then visualized using bright-field microscopy. i). Quantitation of the data in (h). Results are the mean ± SEM of the relative culture plate area taken-up by cells in three randomly selected frames. Statistical significance was determined using a 2-way ANOVA test followed by Sidak’s multiple comparisons test.
