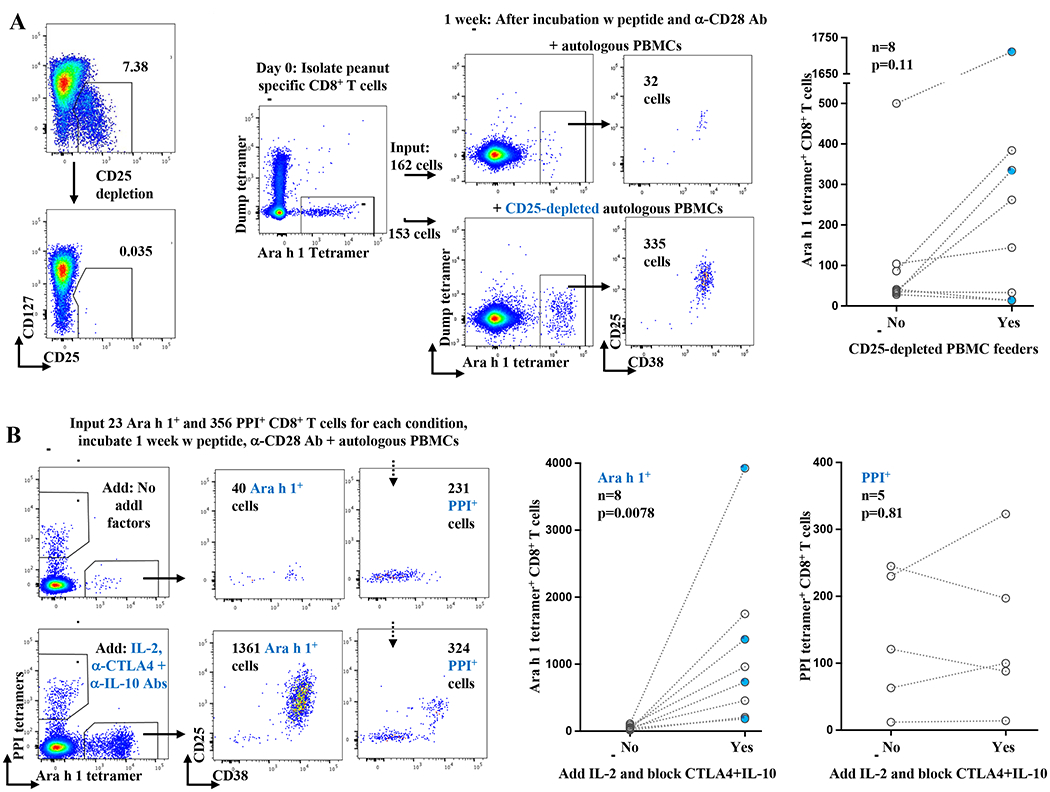
FIG 2.

A, Enhanced expansion of CD8+ T cells specific for Ara h 1 after the depletion of CD25+ cells from PBMC feeders in the case of some nonallergic individuals, but not others.
Left: Example depletion of CD25hiCD127lo CD4+ regulatory T cells from autologous PBMC feeder cells. Flow cytometry plots gated on CD4+ T cells.
Middle: CD8+ T cells specific for Ara h 1 were isolated by tetramer enrichment from a HLA-A*02:01+ blood bank donor as in Figure 1B. An equal number of Ara h 1 specific CD8+ T cells was then incubated for one week with cognate peptide, anti-CD28 antibody, and either whole autologous PBMCs or autologous PBMCs that had been depleted of CD25+ cells. Flow cytometry plots gated on CD8+ T cells.
Right: Cumulative results from 8 blood bank donors. Each pair of points connected by a line represents one sample. Blue points represent samples for which donors were confirmed peanut IgE negative. P value calculated by Wilcoxon signed rank test, 2 tailed.
B, CTLA-4 and IL-10 blockade combined with the addition of IL-2 promote the expansion of Ara h 1 (i.e., food specific) CD8+ T cells, but not self antigen specific CD8+ T cells.
Left: CD8+ T cells specific for Ara h 1 or human preproinsulin peptide(s) (PPI 2:10 and 15:24) were isolated by tetramer enrichment from a HLA-A*02:01+ blood bank donor. An equal number of enriched cells was then incubated with cognate peptides, anti-CD28 antibody, and autologous PBMCs (without CD25 depletion) +/− IL-2 with blocking antibodies to both CTLA-4 and IL-10. Flow cytometric plots gated on CD8+ T cells show analysis after one week.
Middle and Right: Cumulative results of CD8+ T cells specific for either Ara h 1 (middle) or PPI (right). Each pair of points connected by a line represents one blood bank sample. IgE negative. Blue points represent samples for which donors were confirmed peanut P value calculated by Wilcoxon signed rank test, 2 tailed.
