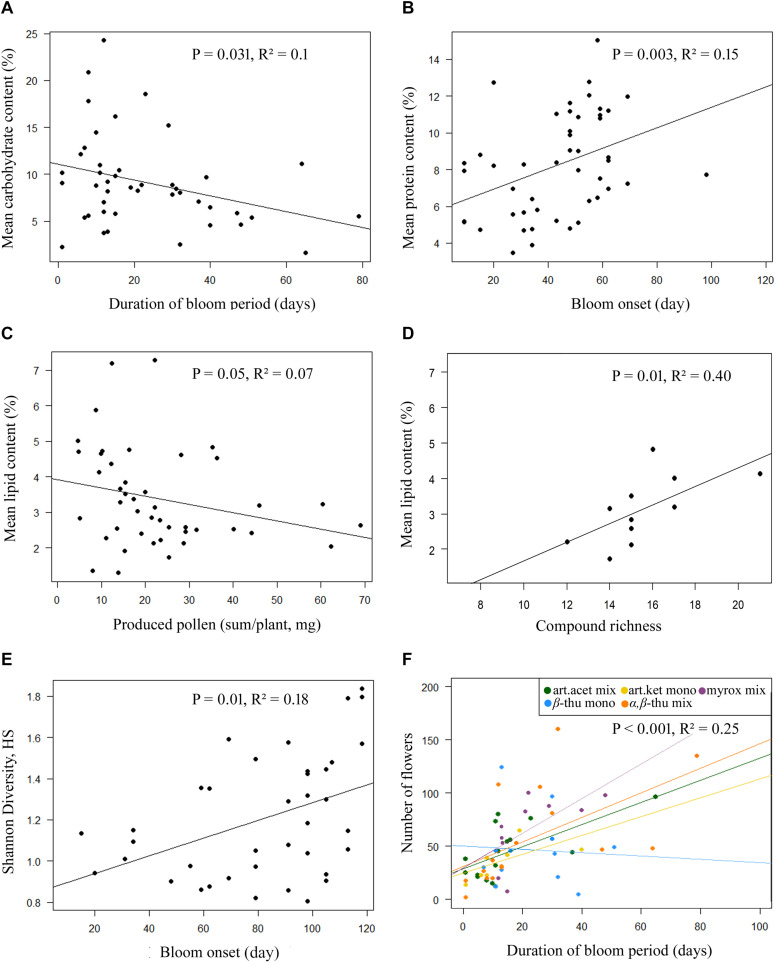
FIGURE 2.
Linear regression plots for significant correlations of pollen macronutrient contents (A–D), (Shannon) diversity or richness of detected compounds in pollen hexane surface washes (D,E), and the number of produced flower heads per plant of Tanacetum vulgare (F) in relation to pollen and flower phenology parameters, namely the duration of the bloom period (A,F), bloom onset (B,E), the amount of produced pollen per plant (C), and the number of detected compounds in pollen hexane surface washes (D). In the plot (F), the data for bloom period duration and number of flowers are displayed with different colors for chemotypes (see legend), as these data differed particularly strong between the chemotypes.

