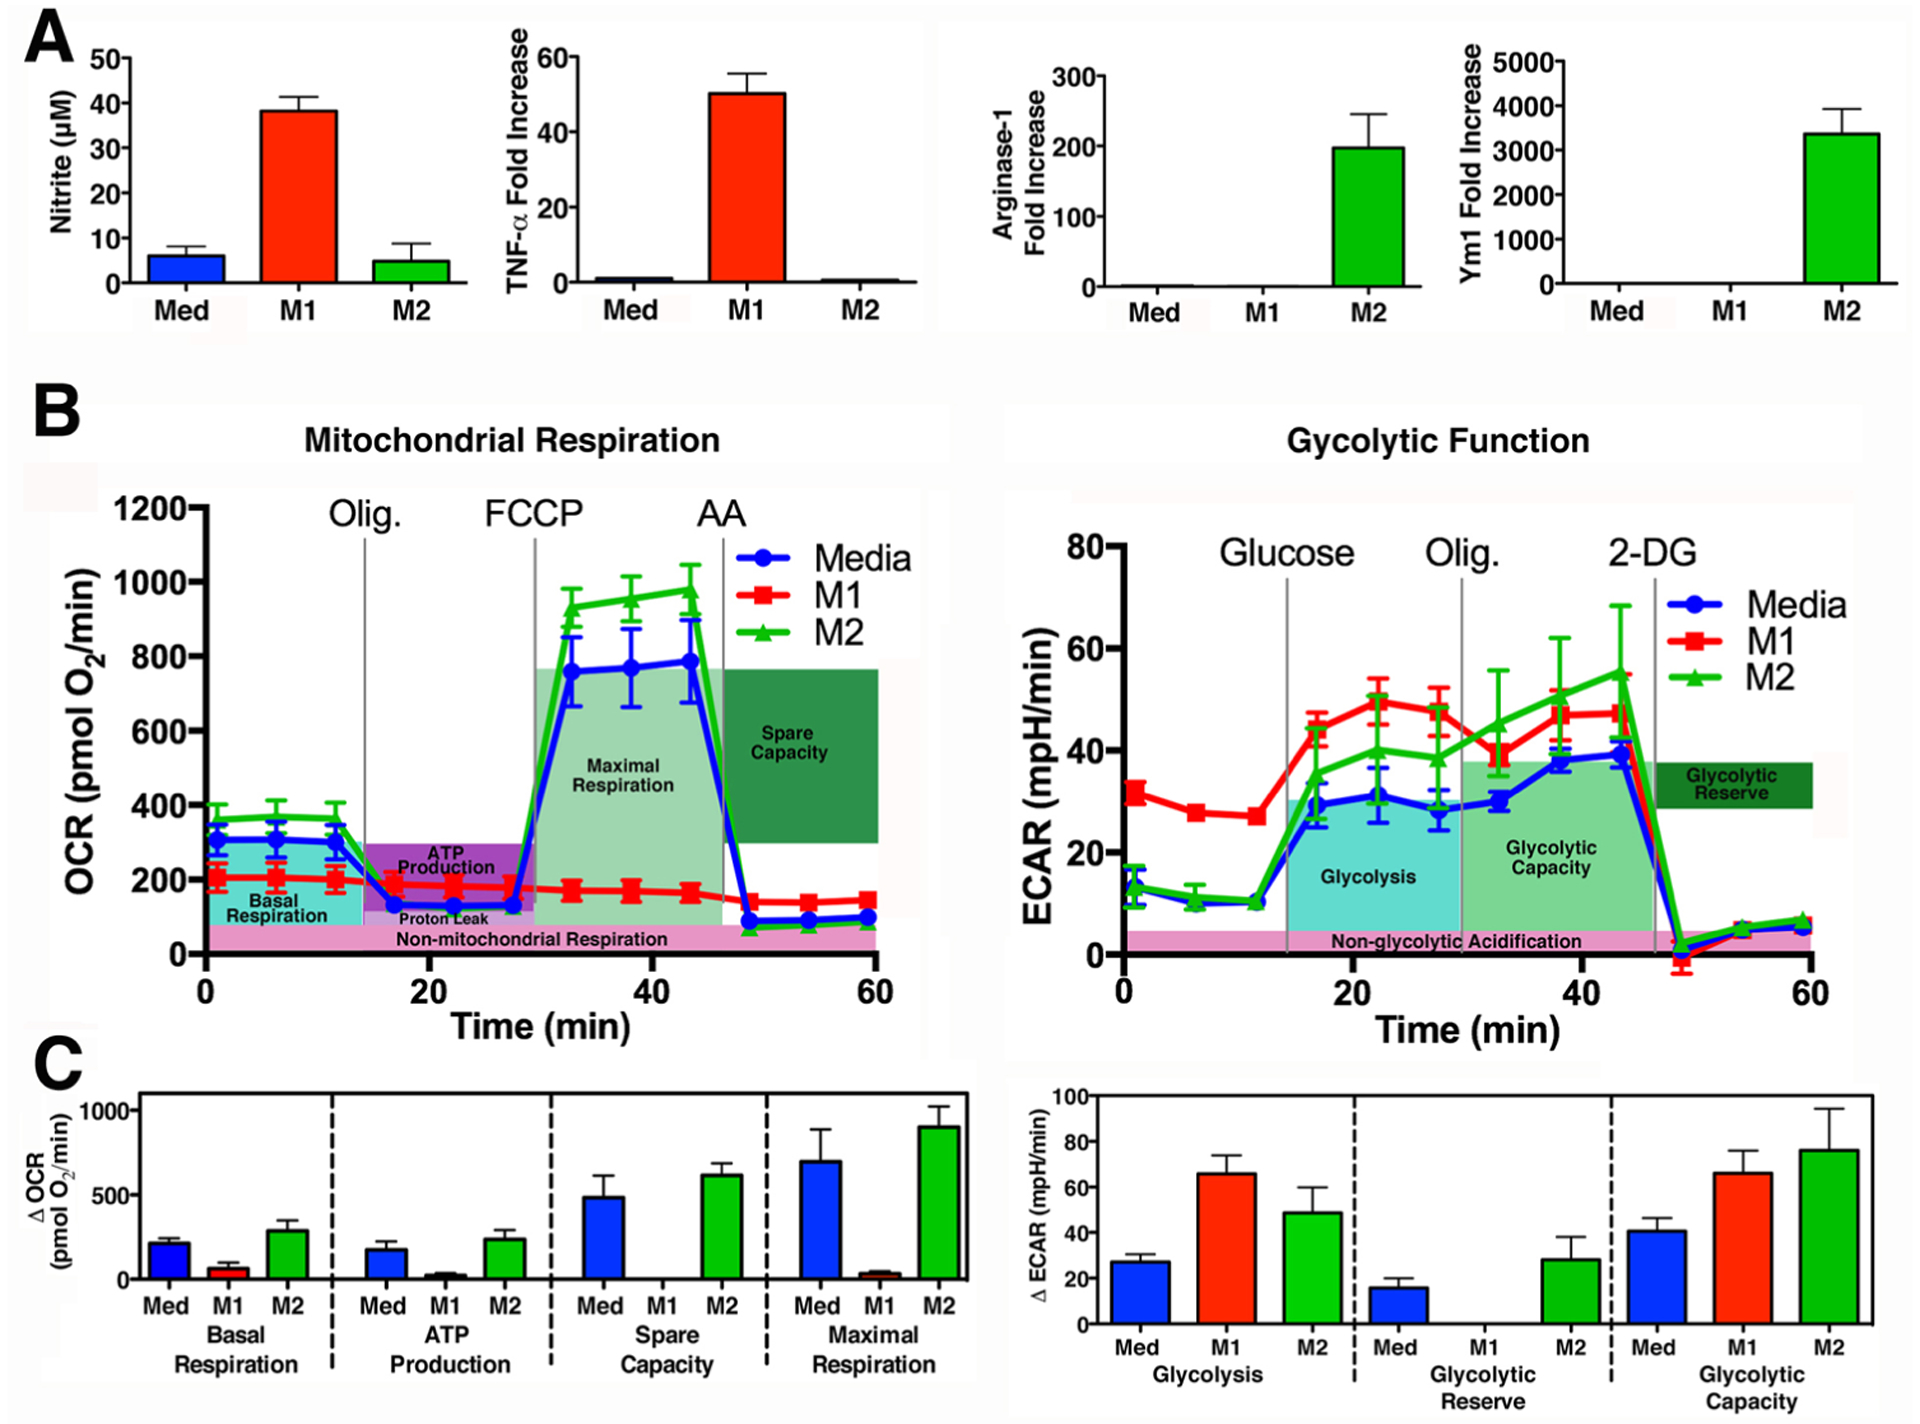
Figure 2: Macrophages treated with LPS and IFN-γ acquire M1 markers and shift metabolism to aerobic glycolysis.

(A) Primary WT macrophages were treated with media alone (Med; blue), LPS (10 ng/ml) and IFN- γ (20 ng/ml) (M1; red) or IL-4 (40 ng/ml) (M2; green) for 48 h. M1 Activation was assessed by measuring the NO. byproduct, nitrite, using the Griess assay and by qRT-PCR to measure Tnf expression, by comparing inducible levels to levels in macrophages treated with medium alone after normalization to Hprt expression. M2 activation was assessed by measuring Arg1 and Ym1 expression. (B)(C) Glycolytic Stress Test and Mitochondrial Stress Test performed on macrophage cultures derived from 4 individual mice, treated as described above in (A) for 24 h. (B) Mean ± SEM shown as a Seahorse wave plot. ECAR (Extracellular Acidification Rate), OCR (Oxygen Consumption Rate), Olig (Oligomycin), 2-DG (2- deoxyglucose), FCCP (Carbonyl cyanide 4-(trifluoromethoxy)phenylhydrazone), AA (Antimycin A). (C) Bar graphs of measurements to assess individual parameters of glycolysis and mitochondrial respiration.
