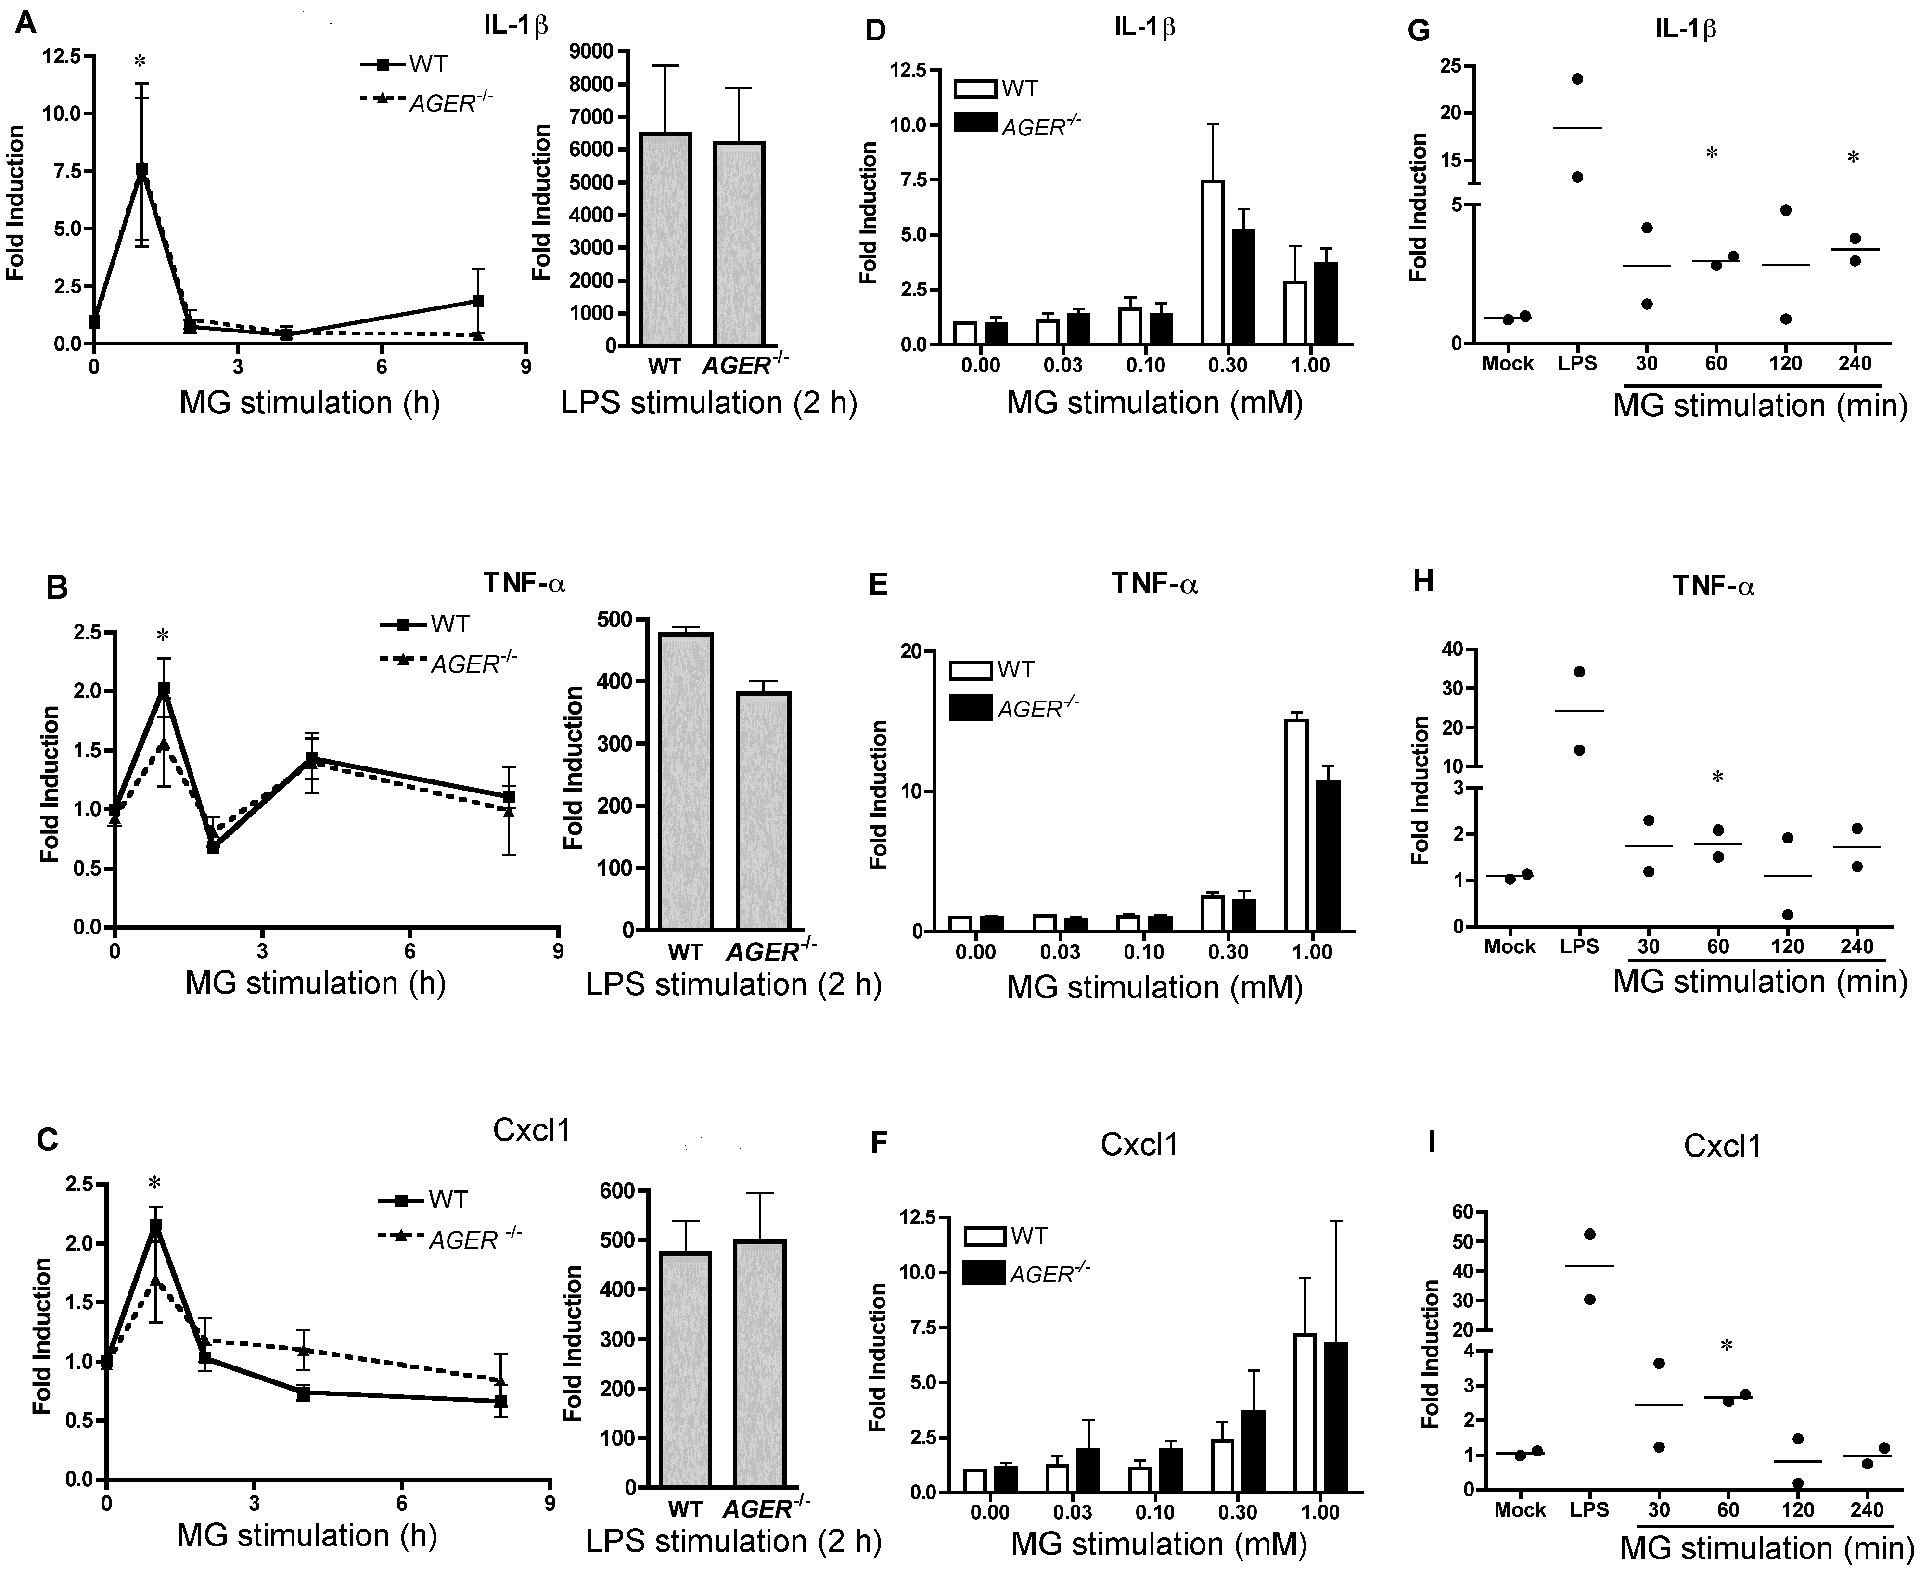
Figure 5: MG stimulation of primary mouse macrophages fails to induce robust cytokine expression compared to LPS.

Mouse macrophages from WT or Ager−/− mice were stimulated with MG (0.3 mM) for the indicated time points (left graph) or LPS (100 ng/ml; right graph) for 2 h. Expression of (A) Il1b, (B) Tnf, (C) Cxcl1 were determined by qRT-PCR. Mouse macrophages from WT or Ager−/− mice were stimulated with varying doses of MG for 1 hr. Expression of (D) Il1b, (E) Tnf, or (F) Cxcl1 expression were determined by qRT-PCR. The data for panels (A- F) represents the mean ± SD of 3 independent experiments. * Denotes p < 0.05. Mouse BMDM from WT mice were stimulated with MG (0.3 mM) for the indicated time points or LPS (100 ng/ml) for 30 min. Expression of (G) Il1b, (H) Tnf, or (I) Cxcl1 expression were determined by qRT-PCR. Data in panels (G-I) represent the mean (lines) of 2 independent experiments. Each symbol represents the value from each experiment.
