Fig. 3.
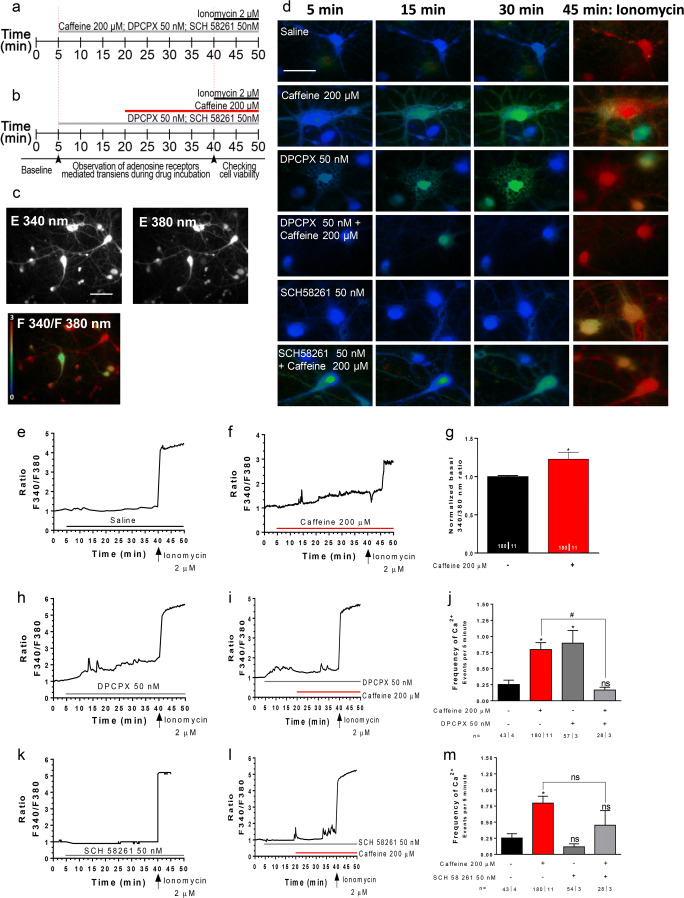
Caffeine exposure increases intracellular Ca2+ levels and the frequency of Ca2+ transients in neuron cell culture. a, b Time lines representing the order and timing for each drug administration. c Ca2+ imaging and representative images of relative fluorescence in 340 and 380 nm. d Representative images of neurons kept all time in saline (first row) or to be challenged (immediately after min 5) with caffeine (200 μM), DPCPX (50 nM), and SCH 5861 (50 nM), as indicated in the left panel of each row; the recording times are indicated in the top panel of each column; the last column shows the response to the Ca2+ ionophore ionomycin (2 μM), to access maximum Ca2+ increase, thus an indirect way of accessing cell viability before ionomycin; min 5 (first column) shows responses immediately before addition of drugs. The time course panels show representative tracings (one tracing per cell) of the changes of the ratio between responses to F340 and F380 nanometer wavelength (F340/F380) during exposure to saline (e), caffeine (f), DPCPX (h), caffeine in the presence of DPCPX (i), SCH 58261 (k), caffeine in the presence of SCH 58261 (l), as indicated by the horizontal bars; in each cell, the tracings have been normalized, so that the first ratio of the first recording was taken as 1. Panel g illustrates the averaged F340/F380 ratio recorded at 0–5 min in the absence of caffeine and at 40–45 min in the presence of caffeine, as indicated below the bars. Panels j and m show averaged frequency of Ca2+ transients recorded during exposure to the drug conditions indicated below each bar. Values in similar drug conditions in j and m are from the same cells and are repeated to allow comparisons. Data in g, j, and m are represented as mean ± S.E.M; n values are indicated below each bar and correspond to the number of cells/taken from the identified number of independent cultures. *p < 0.05; ns: p > 0.05 as compared with control values in saline; #p < 0.05 as compared with values with caffeine in the absence of the selective adenosine receptor antagonists (Mann-Whitney test in g; two-way ANOVA followed by Bonferroni post hoc test in j and m). Scale bar in c: 20 μm and d: 10 μm, and applies to all images in the same panel

