Fig. 4.
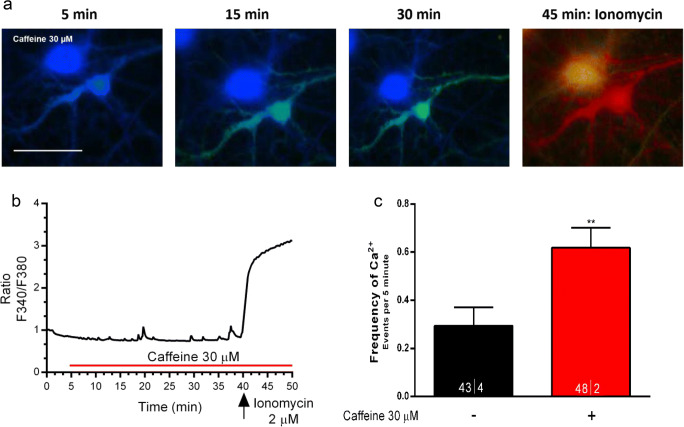
At a lower concentration (30 μM), caffeine also increases the frequency of Ca2+ transients in neurons. a Representative images of neurons taken immediately before adding caffeine (left image); caffeine was added at 5 min; the images displayed were taken at the times indicated above each recording; the last image shows the response to the Ca2+ ionophore ionomycin (2 μM), to access maximum Ca2+ increase, thus an indirect way of accessing cell viability before ionomycin. b Representative tracing of time-course changes of the ratio between responses to F340 and F380 nanometer wavelength during exposure of one of the cells to caffeine; the tracing has been normalized so that the first ratio of the first recording was taken as 1. Panel c shows averaged frequency of Ca2+ transients recorded during caffeine perfusion; data are represented as mean ± S.E.M; n values are indicated below each bar and correspond to the number of cells/taken from the identified number of independent cultures. **p < 0.01 as compared with control values in saline (Wilcoxon signed-rank test in c). Note caffeine 30 μM, mimicked effect of caffeine 200 μM on the frequency of Ca2+ transients. Scale bar in a: 10 μm, and applies to all images

