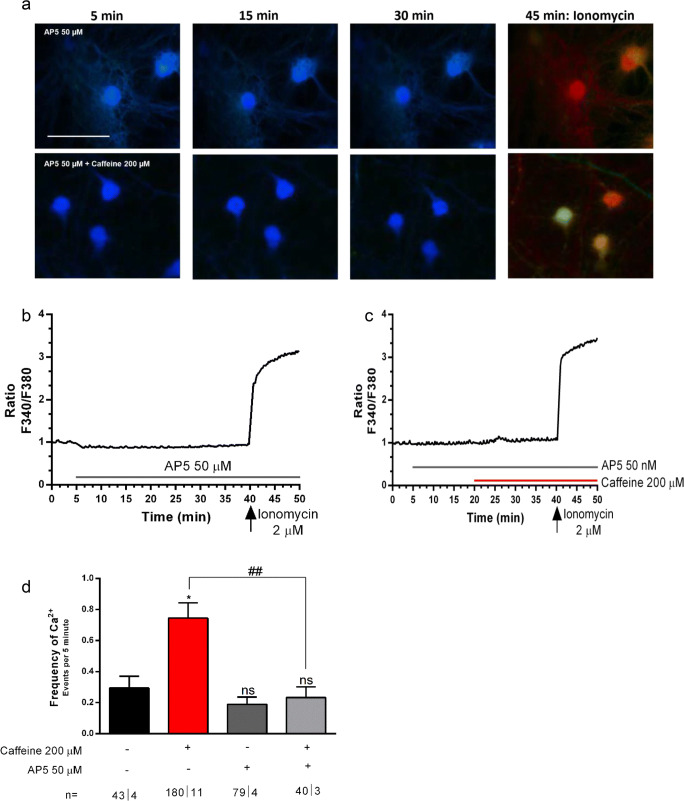
Fig. 5.
The increase in intracellular Ca2+ levels and induction of Ca2+ transients caused by caffeine (200 μM) is mediated by NMDAR. a Representative images of neurons taken at the times indicated on the top of the images; the first row shows images taken from neurons where only the effect of the NMDAR antagonist, AP5 (50 μM), was tested; the second row shows images from neurons where the effect of caffeine in the presence of AP5 was tested; the first image in each row was taken immediately before adding any drug (5 min) and the last image in each row represents the response to the Ca2+ ionophore, ionomycin (2 μM), added to access maximum Ca2+ increase, thus an indirect way of accessing cell viability before ionomycin; in both rows, the neurons were exposed from 5 min onwards to AP5 (50 μM); in the lower row, the neurons were then further exposed to caffeine (200 μM), which was added at 20 min, therefore between the 2nd and 3rd image. Panels b and c show representative tracings (one tracing per cell) of the time-course changes of the ratio between responses to F340 and F380 nanometer wavelength during exposure to AP5 only (b), or caffeine in the presence of AP5 (c), which were added at the times indicated by the horizontal bars; in each cell, the tracings have been normalized so that the first ratio of the first recording was taken as 1. Panel d shows averaged frequency of Ca2+ transients recorded in the drug conditions indicated below each bar; values under similar drug conditions than those in Fig.4 j and m are the same and are repeated here to allow comparisons; data are represented as mean ± S.E.M; n values are indicated below each bar and correspond to number of cells/taken from the identified number of independent cultures. *p < 0.05; ns: p > 0.05 as compared with control values in saline; ##p < 0.01 as compared with values with caffeine in the absence of the selective NMDAR antagonists (Two-way ANOVA followed by the Bonferroni post hoc test in d. Scale bar in a: 10 μm, and applies to all images

