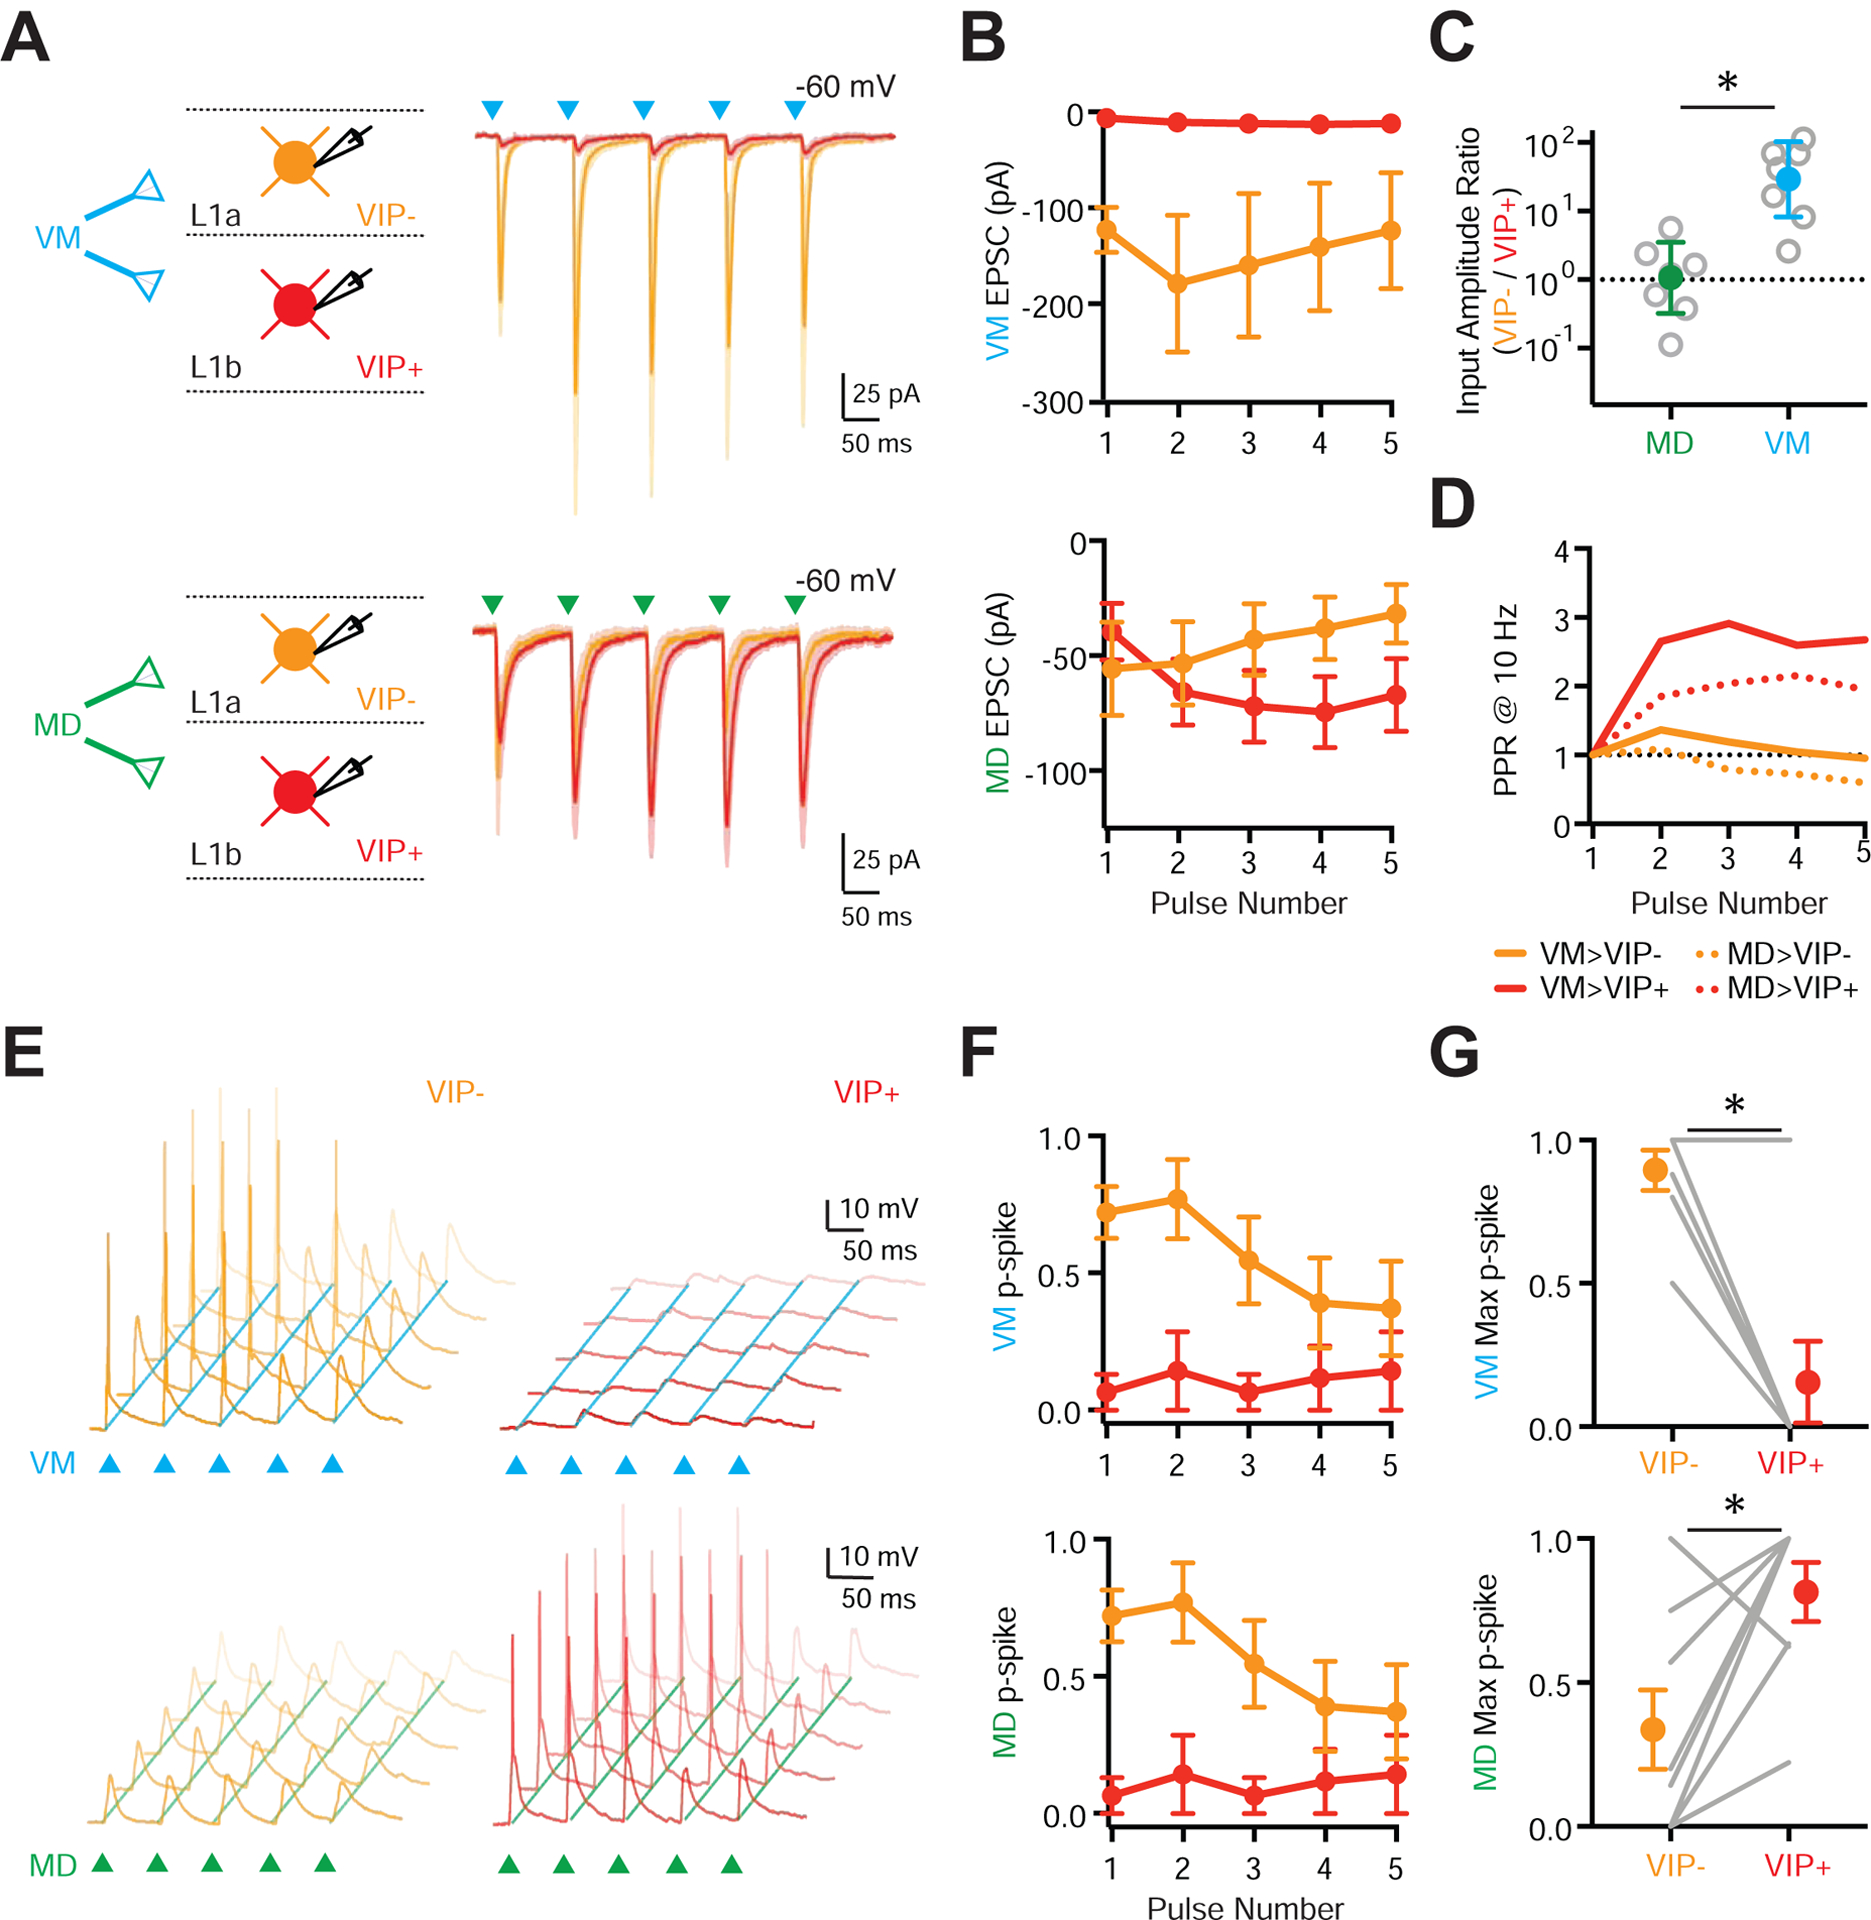
Figure 3. MD and VM differentially recruit interneuron populations in L1a and L1b.

(A) Left: Schematic for recordings of VM (top) and MD (bottom) inputs onto pairs of VIP− (equivalent to NDNF+) cells in L1a (orange) and VIP+ cells in L1b (red). Right: Average voltage-clamp recordings at −60 mV showing VM-evoked (blue triangles) and MD-evoked (green triangles) EPSCs at pairs of L1 interneurons.
(B) Summary of VM-evoked (top) and MD-evoked (bottom) EPSC amplitudes versus pulse number at pairs of L1 interneurons.
(C) Summary of (VIP− / VIP+) input ratio for first VM-evoked (blue) and MD-evoked (green) EPSC amplitude at pairs of L1 interneurons. Note the logarithmic axis.
(D) Summary of paired-pulse ratio (PPR) for VM-evoked (solid lines) and MD-evoked (dashed lines) EPSCs at VIP− and VIP+ cells.
(E) Top: Similar to (A) for VM-evoked (top) and MD-evoked (bottom) EPSPs and APs at pairs of VIP− (left) and VIP+ (right) cells in response to stimulus trains (triangles), evoked from resting membrane potential. Traces shown from representative pairs of neurons, where each panel shows five traces recorded from the same cell.
(F) Similar to (B) for AP probability (p-spike) for VM (top) and MD (bottom) stimulation.
(G) Summary of maximum VM-evoked (top) and MD-evoked (bottom) p-spike at pairs of L1 interneurons across a stimulus train. Lines represent individual pairs.
Averages are mean ± SEM (B, F, G) or geometric mean ± 95% CI (C). * = p < 0.05.
