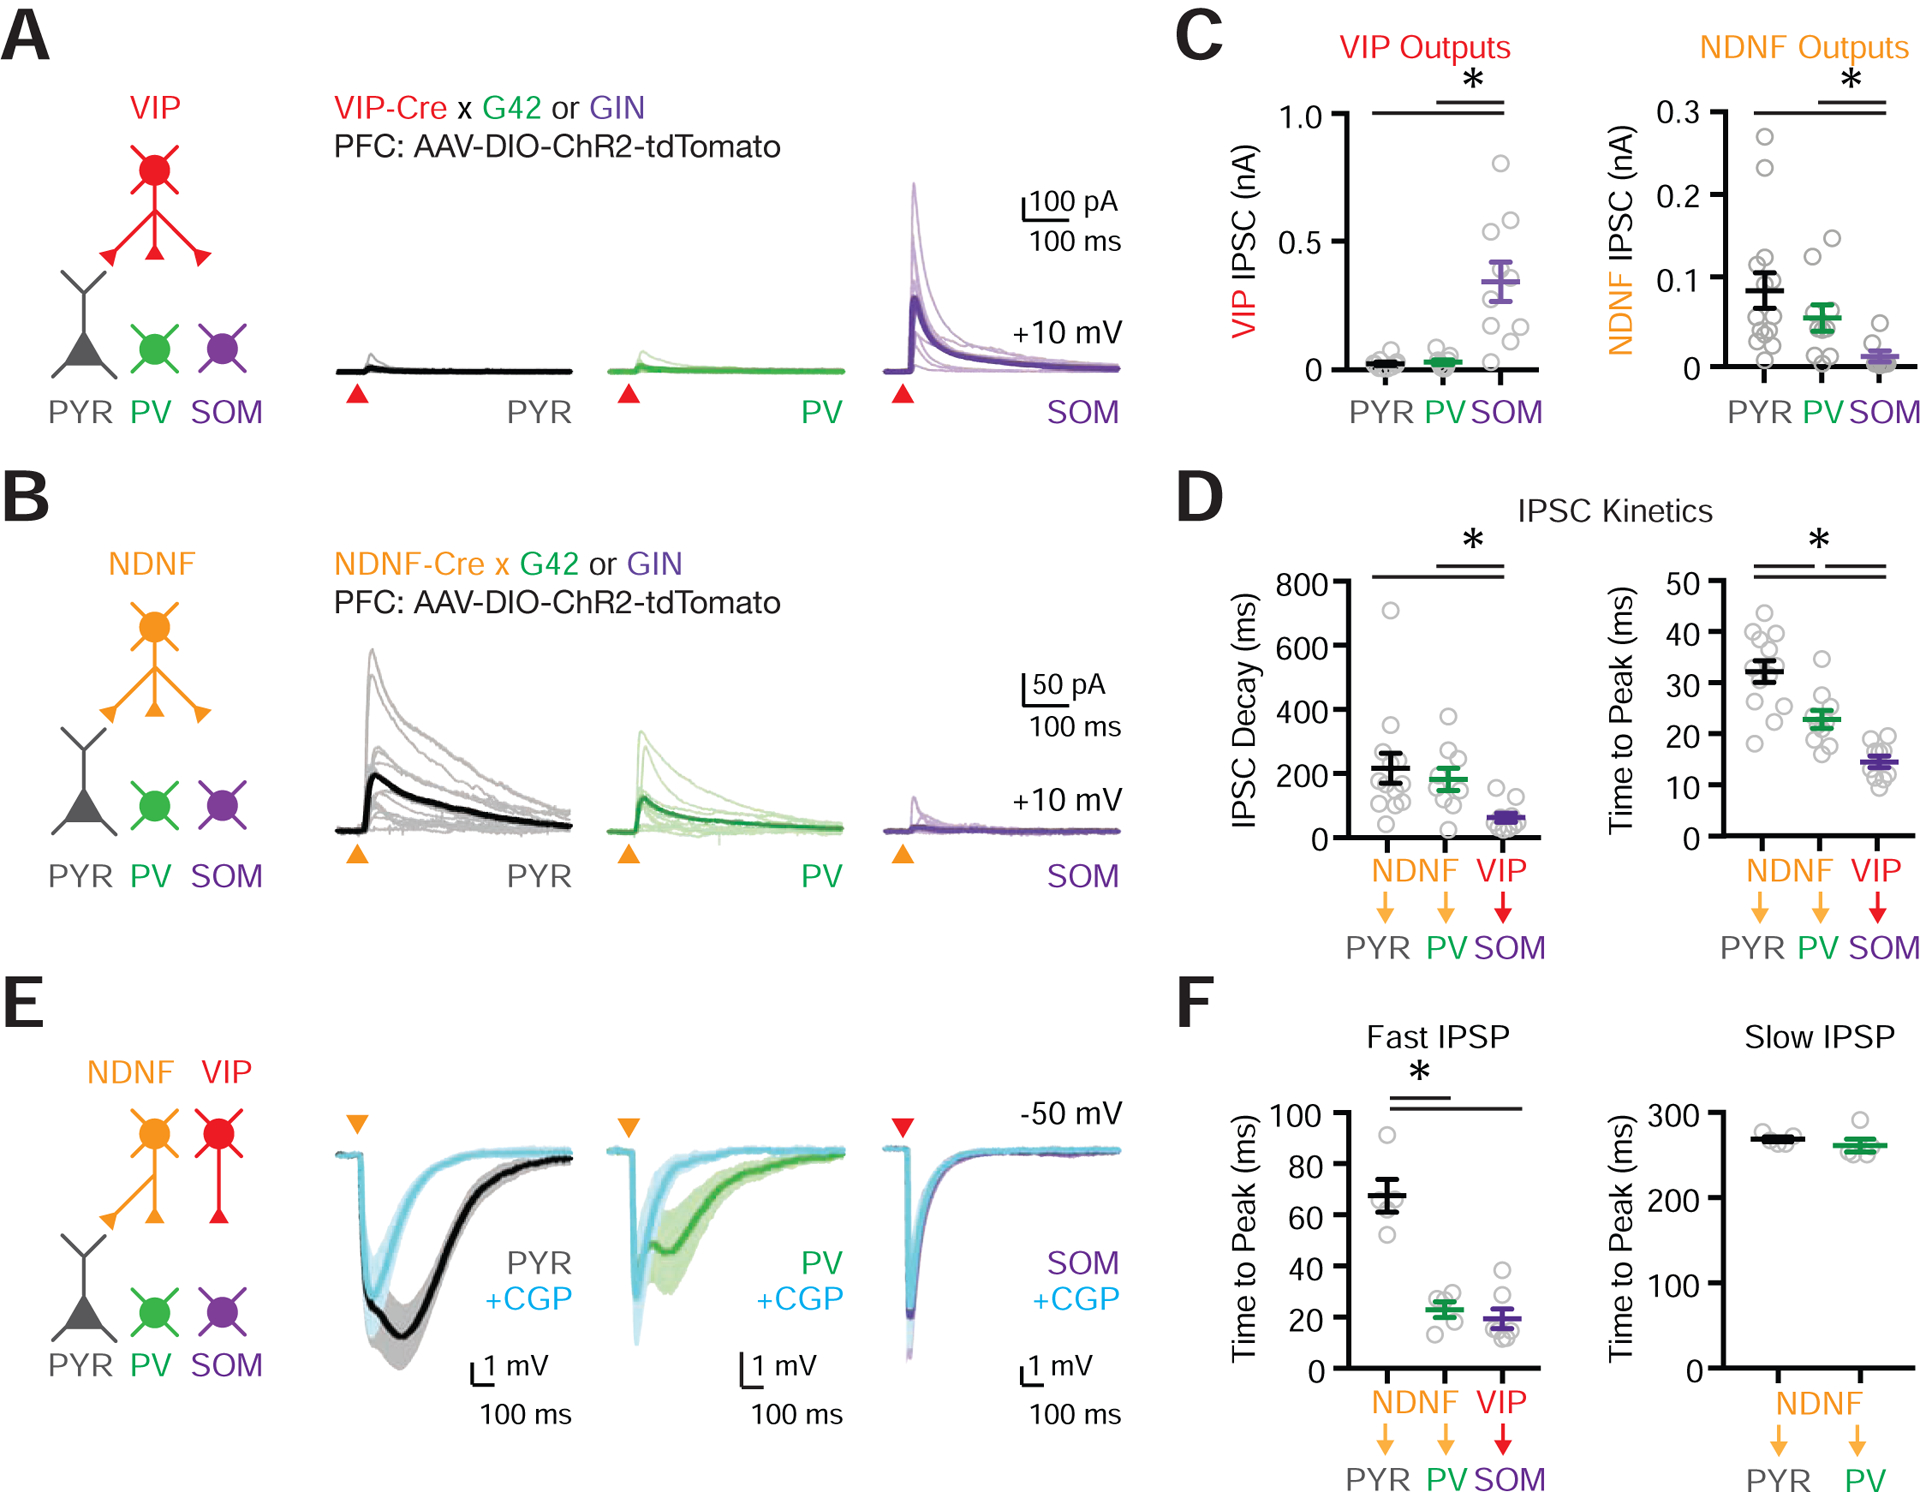
Figure 4. L1 interneurons mediate distinct inhibitory and disinhibitory pathways.

(A) Left: Schematic for studying outputs of VIP+ cells (red) onto pyramidal (PYR, black), PV+ (G42, green) and SOM+ (GIN, purple) cells in L2/3 of PFC. AAV expressing Cre-dependent ChR2 was injected into the PFC of VIP-Cre × G42 or VIP-Cre × GIN mice. Right: Voltage-clamp recordings at +10 mV showing VIP+ inputs to postsynaptic targets. Light traces are individual cells and dark traces are averages. Triangles show light stimulation.
(B) Similar to (A) but for NDNF+ connections (orange).
(C) Left: Summary of VIP+-evoked IPSC amplitude. Right: Summary of NDNF+-evoked IPSC amplitude.
(D) Left: Summary of IPSC decay kinetics for NDNF+ → PYR, NDNF+ → PV+ and VIP+ → SOM+ connections. Right: Summary of IPSC time to peak for NDNF+ → PYR, NDNF+ → PV+ and VIP+ → SOM+ connections.
(E) Left: Schematic for studying outputs from NDNF+ (orange) and VIP+ (red) cells. Right: Current-clamp recordings at −50 mV before and after bath application of the GABAB-R antagonist CGP. Triangles show light stimulation.
(F) Left: Summary of the IPSP time to peak for fast NDNF- and VIP-mediated IPSPs for NDNF+ → PYR, NDNF+ → PV+ and VIP+ → SOM+ connections. Right: Similar but for slow NDNF-mediated IPSPs for NDNF+ → PYR and NDNF+ → PV+ connections.
Values are mean ± SEM (C, D, F). * = p < 0.05.
See alsoFigure S4
