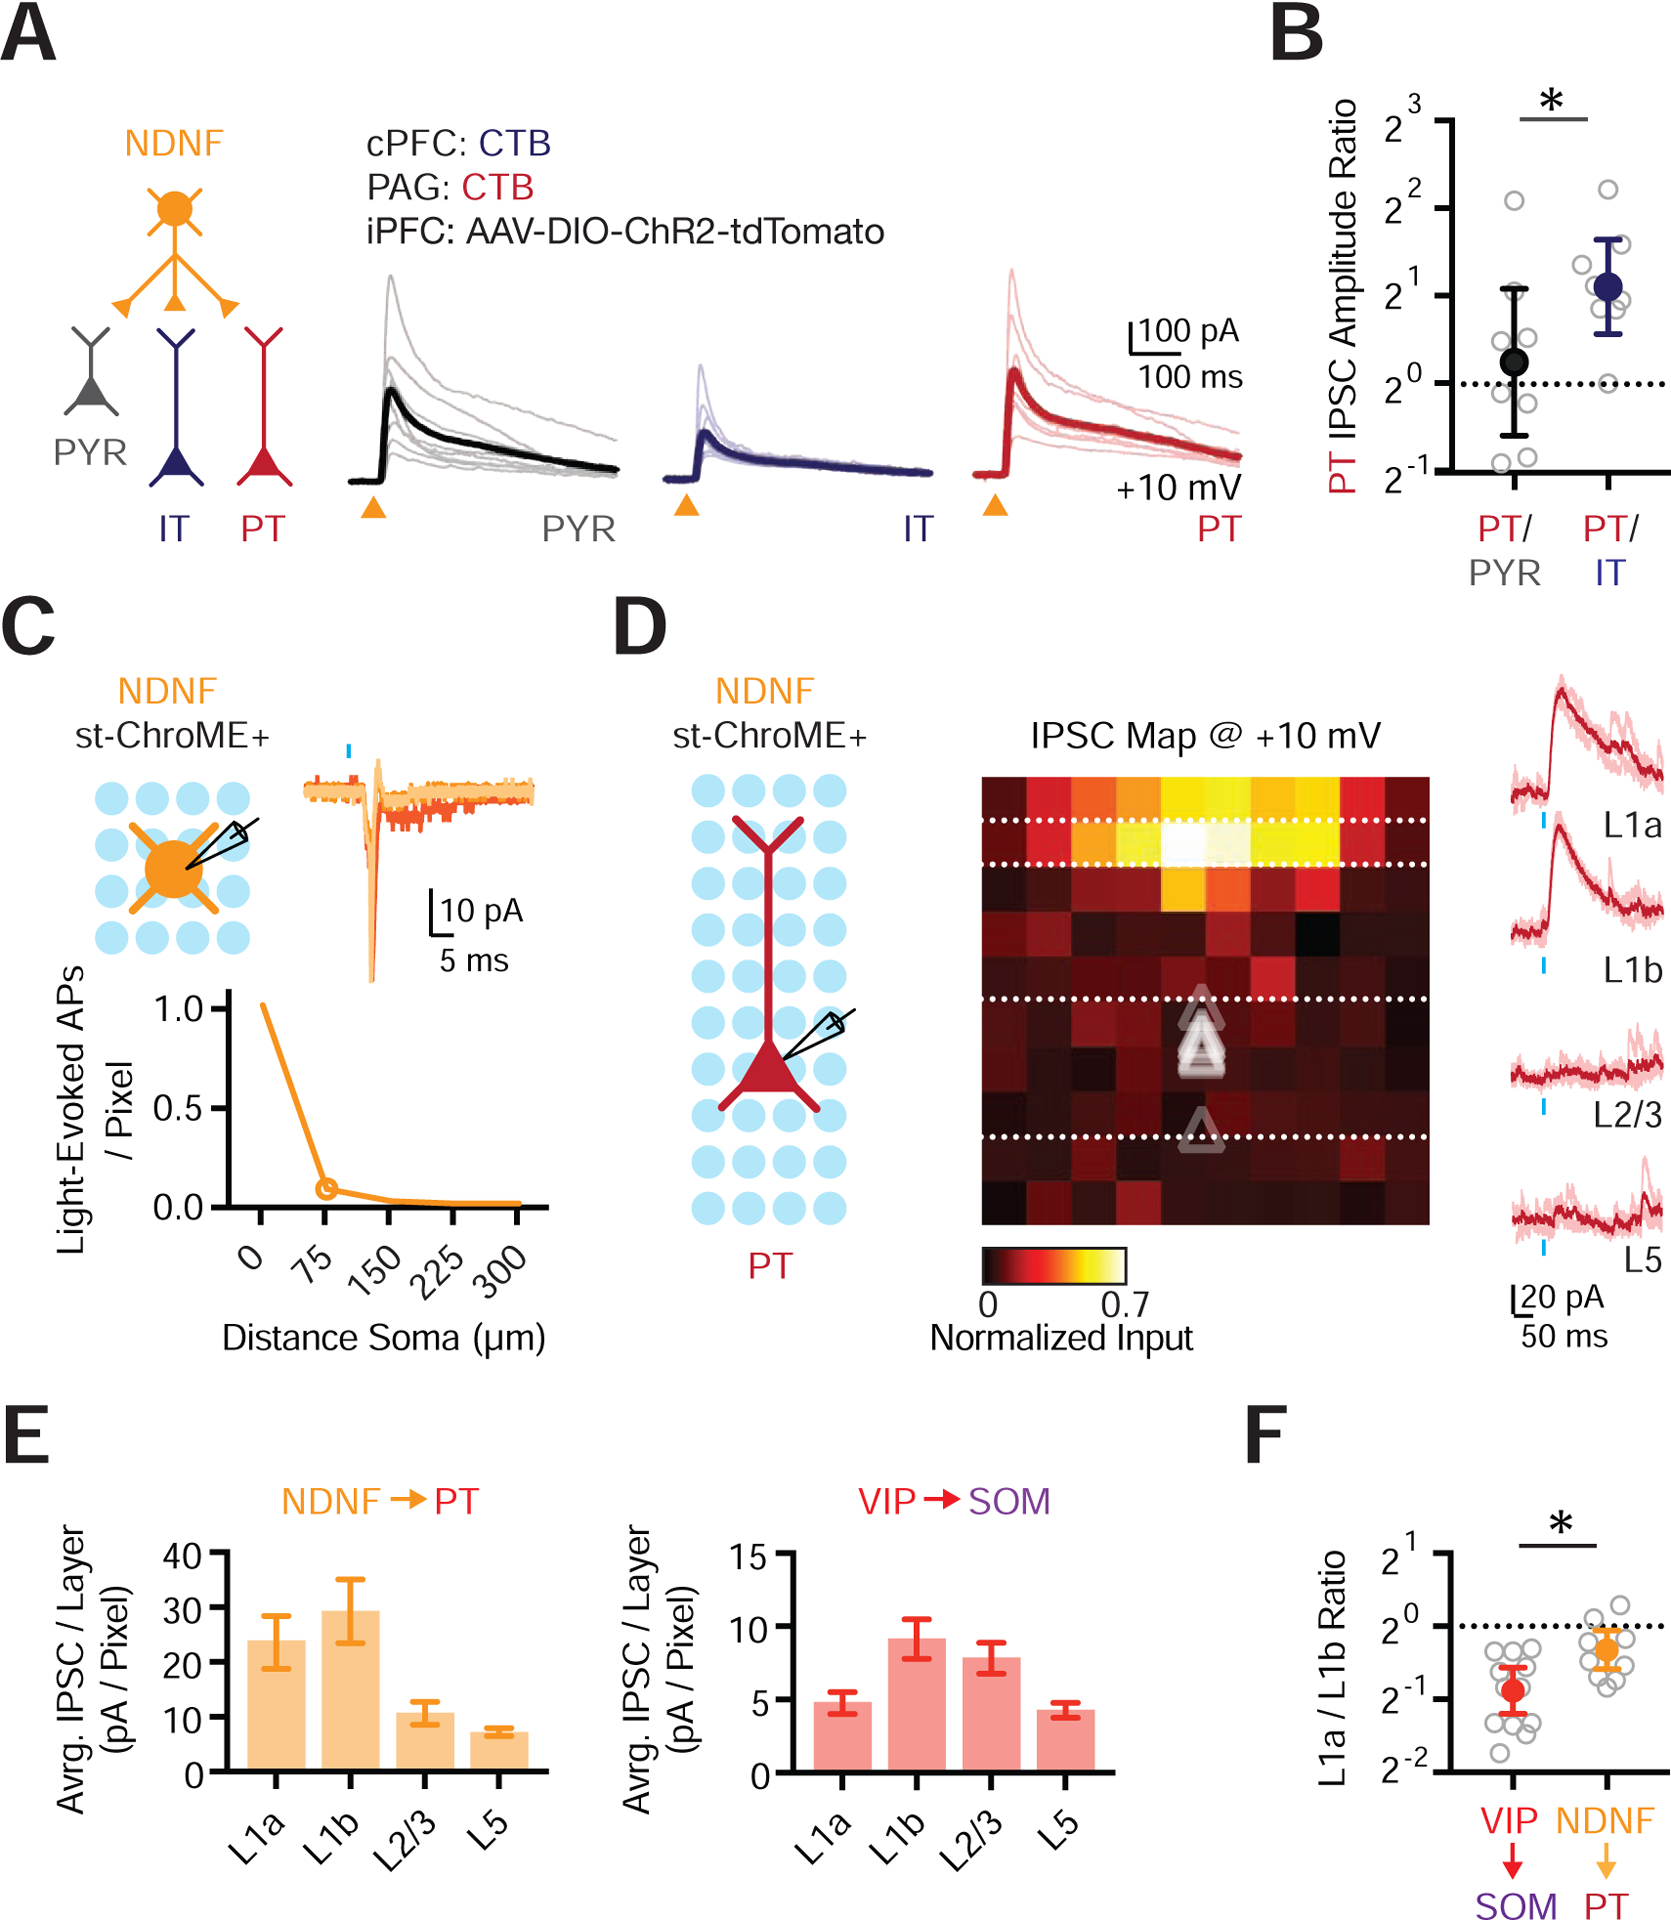
Figure 5. NDNF+ cell targeting of cortical pyramidal neuron subtypes.

(A) Left: Schematic for studying outputs from NDNF+ cells (orange) onto PYR (black), IT (blue) and PT (red) cells. Right: Voltage-clamp recordings at +10 mV showing NDNF-evoked IPSCs at the three different cell types. Light traces are individual cells and dark traces are averages. Triangles show light stimulation.
(B) Summary of IPSC amplitude ratios from recorded triplets, calculated by dividing the IPSC amplitude recorded in PT cells by the IPSC amplitude recorded in either PYR or IT cells. Note the logarithmic axis.
(C) Top left: Recording schematic, showing grid of light spots. Top right: Representative examples of light-evoked action potentials (APs) recorded in cell-attached mode from an NDNF+ st-ChroME+ cell stimulating over the soma. Blue bar shows light stimulation. Bottom: Summary of the number of light-evoked APs per pixel as a function of distance from the soma for all NDNF+ st-ChroME+ cells recorded in cell-attached mode.
(D) Left: Recording schematic, showing grid of light spots. Middle: Normalized maps of NDNF-evoked IPSCs at PT cells, indicating location of presynaptic cells. Triangles show soma depth of recorded cells. Individual pixels are 75 × 75 μm. Right: Representative examples of NDNF-evoked IPSCs recorded in voltage-clamp at +10 mV across different layers. Light traces are individual trials and dark traces are averages. Blue bar shows light stimulation.
(E) Left: Summary of IPSC amplitude per pixel calculated by dividing the total current (in pA) per layer by the number of pixels, showing relative input strength across different layers for maps of NDNF+ connections onto PT cells. Right: Similar for VIP+ connections onto L2/3 SOM+ cells.
(F) Summary of L1a / L1b input ratio for VIP+ → SOM+ and NDNF+ → PT connectivity maps. Values are mean ± SEM (C, E) or geometric mean ± 95% CI (B, F). * = p < 0.05.
See also Figure S5
