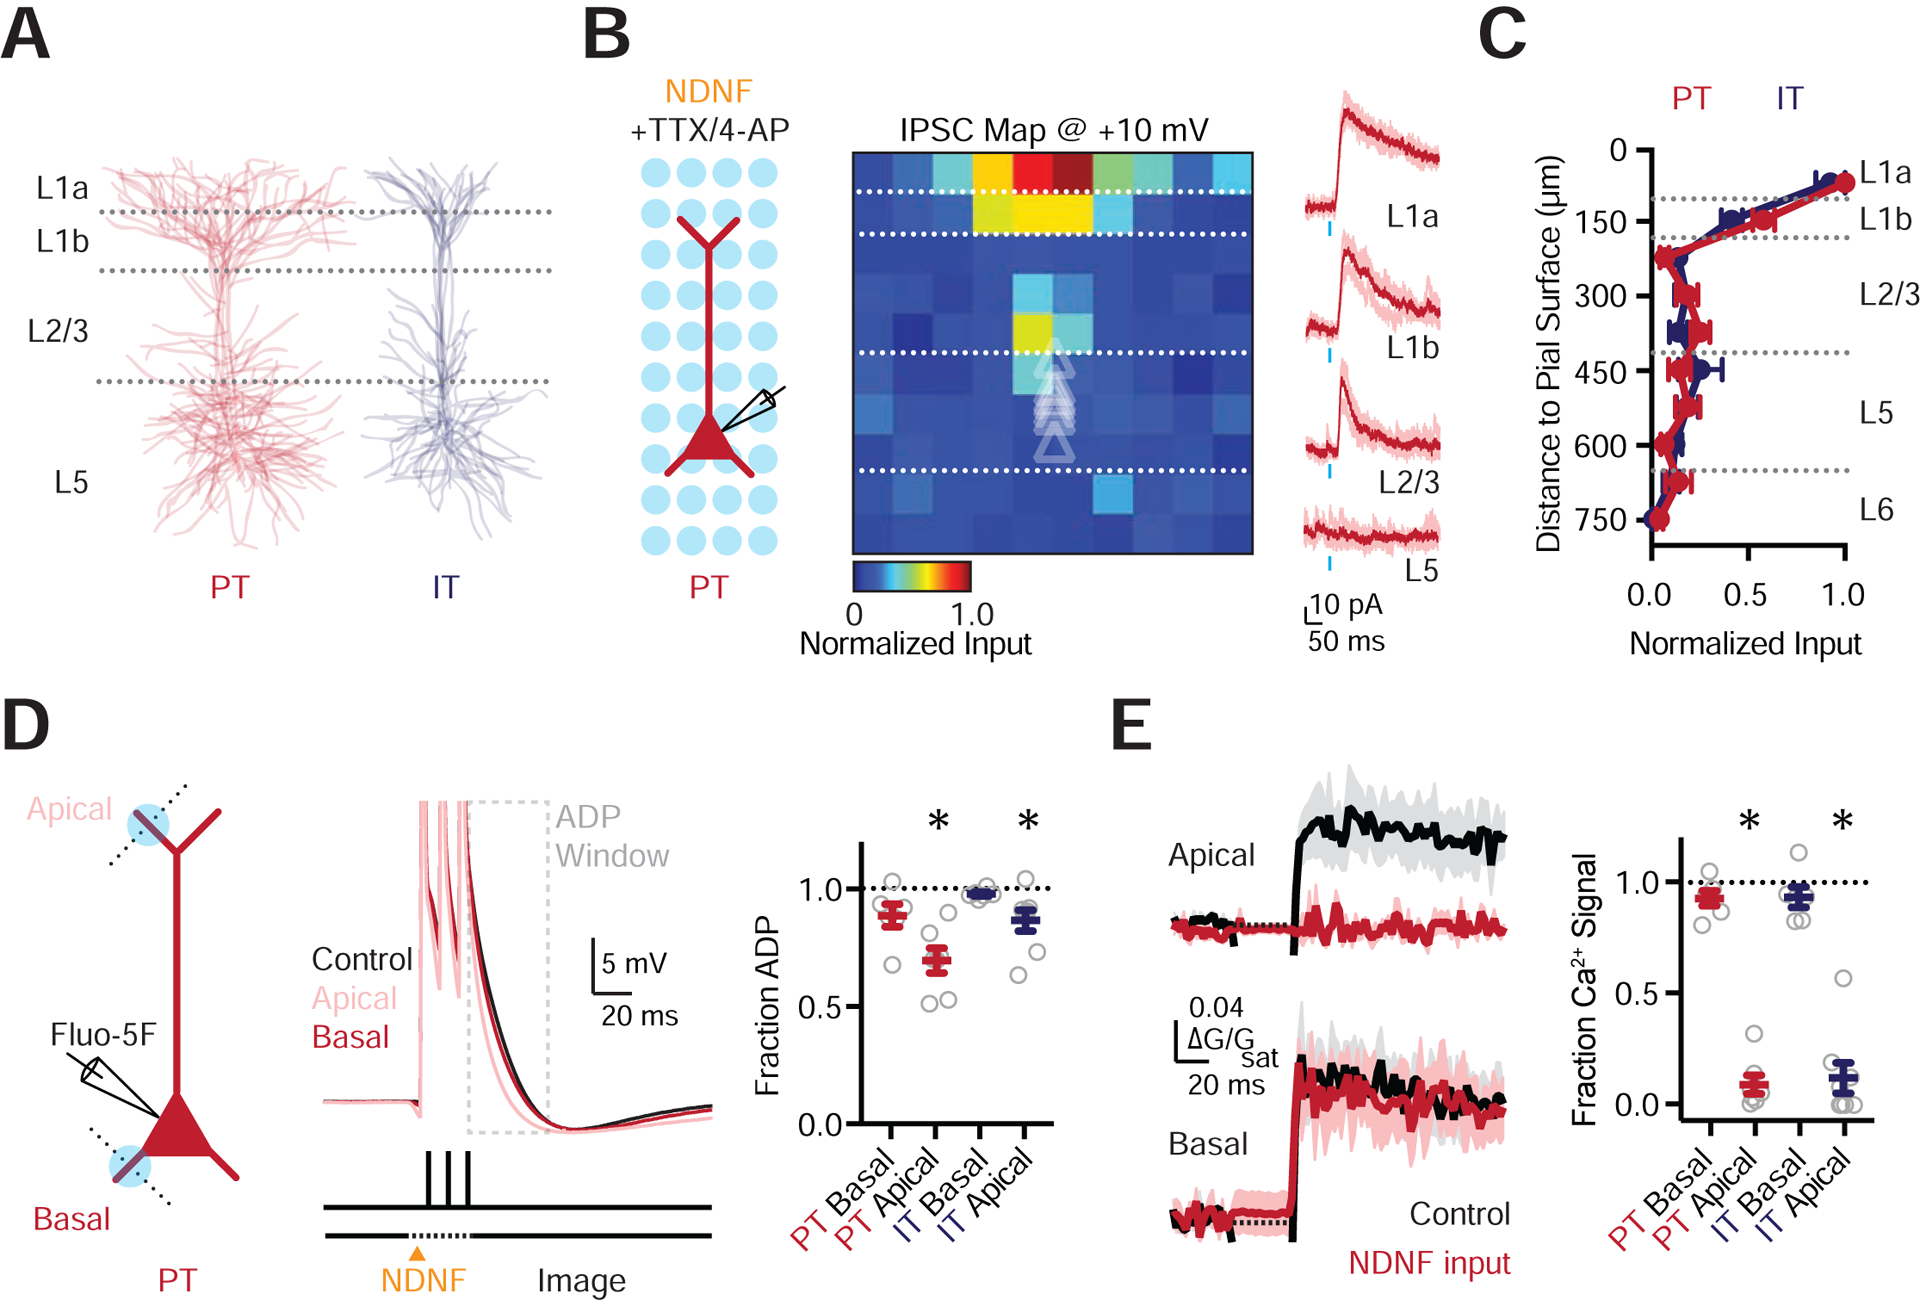
Figure 6. NDNF+ interneurons control apical dendrite electrogenesis.

(A) Morphological reconstructions of PT and IT cells, each showing 6 overlaid cells.
(B) Left: Recording schematic, showing grid of light spots. Middle: Normalized sCRACM for NDNF-evoked IPSCs onto PT cells, recorded at +10 mV in the presence of TTX and 4-AP, indicating synapse location. Triangles show soma depth of recorded cells. Individual pixels are 75 × 75 μm. Right: Representative examples of NDNF-evoked IPSCs at the different layers. Light traces are individual trials and dark traces are averages. Blue bar shows light stimulation.
(C) Summary of normalized NDNF-evoked IPSC amplitude as a function of distance to the pial surface for PT and IT cells.
(D) Left: Schematic of whole-cell recording from PT cells, 1-photon NDNF+ stimulation (blue circles), and 2-photon line-scans (dashed lines). Middle: Somatic action potentials (3 × 100Hz) paired with NDNF+ input to either the apical or basal dendrites. Grey box indicates the region of interest for ADP analysis. Right: Summary of reduction in ADP due to stimulation at the apical but not basal dendrites of PT and IT cells.
(E) Left: Corresponding AP-evoked Ca2+ signals in the apical and basal dendrites, in control conditions (black) or paired with NDNF+ stimulation (red). Right: Summary of reduction in AP-evoked Ca2+ signals due to stimulation at apical but not basal dendrites of PT and IT cells.
Values are mean ± SEM (C, D, E). * = p < 0.05.
See also Figure S6
