

Abstract
Purpose
Glycoprotein is an important constituent of saliva, and the observed increase in salivary glycoproteins such as sialic acid in oral potentially malignant disorder (OPMDs) and OSCC has stimulated the interest of researchers to explore it as a possible biomarker.
Methods
The study used 60 subjects, who were divided into three groups: Group I—20 subjects who were clinically and histopathologically diagnosed with OSCC; Group II—20 subjects who were clinically and histopathologically diagnosed with OPMDs; and Group III—20 healthy subjects with good oral hygiene and with no systemic disorders detected. Two millilitres of unstimulated salivary samples was collected in a pre-sterilized container to analyse total salivary sialic acid (TSA) levels using a sialic acid kit and UV spectrophotometer.
Results
The TSA levels in OSCC (545.45 ± 100.04) were much higher when compared to the level in OPMDs (169.80 ± 66.43) and in healthy subjects (25.45 ± 16.07). Statically significant correlation was observed between different grades of OSCC. Moreover, sialic acid showed 100% sensitivity and specificity between all the three groups. Statistical analysis was done with Kruskal–Wallis, followed by Mann–Whitney post hoc test at P < 0.05. The results suggested the utility of sialic acid as an efficient biomarker.
Keywords: Biomarkers, Oral squamous cell carcinoma (OSCC), Oral potentially malignant disorder (OPMDs), Total sialic acid level (TSA), Saliva
Introduction
Oral cancer is currently the most frequent cause of cancer-related deaths among Indian men, which is usually preceded by oral precancerous states, i.e., most often a persistent leukoplakia or oral submucous fibrosis (SMF) [1]. The incidence and the mortality rate of cancer have shown a sharp increase since the last 2 decades. Therefore, more intense efforts are required to fight against this life-threatening disease [2].
Glycoproteins and glycolipids are important constituents of the cell membrane [3]. Aberrant glycosylations are the universal features of cancer cells. These aberrant glycosylations lead to an increase in turnover and shedding of the malignant cells, which produce a biochemical substance considered as a tumour marker present in serum, plasma and other body fluids [4].
Saliva is a complex biofluid with both organic and inorganic constituents that collectively act to regulate the oral environment. Saliva can reflect virtually the entire spectrum of normal and disease state because of its anatomical proximity to both premalignant and malignant neoplasm [5, 6].
Sialylation and fucosylation are the major types of glycosylation changes which are the typical terminal modification of proteins that mediate vital biological functions [7, 8]. Sialic acid, known as N-acetylneuraminic, is present on the carbohydrate chains of glycoproteins and glycolipids playing an important role in cell recognition, invasiveness, adhesiveness and immunogenicity [9, 10]. Alterations in the sialic acid levels in cancer patients have stimulated interest in this sugar residue as a possible tumour marker [11]. Therefore, this study attempted to compare and correlate the level of TSA in the saliva of healthy subjects with that of study group comprising of OPMDs and OSCC, secondly, to evaluate whether there are any significant changes in salivary TSA in different grades of OSCC and thirdly, to find the sensitivity and specificity value of sialic acid between all the three groups to consider it as a reliable biomarker in the detection of OPMDs and OSCC.
Materials and Methods
A prospective clinical study was conducted on subjects who reported to the outpatient department, the Oxford Dental College, Bommanahalli, Bangalore. Sixty subjects were chosen for the study and were divided into three groups.
Group I—20 subjects who represented patients who were clinically and histopathologically diagnosed with OSCC.
Group II—20 subjects who represented patients who were clinically and histopathologically diagnosed with OPMDs.
Group III—20 healthy subjects with good oral hygiene and with no systemic disorders detected.
All subjects included were in the age group of 20–70 years. The subjects for this study were selected on the basis of inclusion and exclusion criteria.
Inclusion Criteria and Exclusion Criteria
Inclusion criteria were subjects who voluntarily enrolled in the proposed study, subjects diagnosed with OPMDs, subjects diagnosed with OSCC, subjects of either gender with age between 20 and 70 years. Exclusion criteria were those subjects who had undergone or were undergoing radiation therapy and chemotherapy to the head and neck region. Those subjects with any systemic conditions like diabetes mellitus, cardiovascular diseases, endocrine disorder as well as the subjects who were on regular medications that may affect the salivary flow were excluded. Subjects presented with recurrent/or concomitant lesions as well as with various inflammatory conditions including poor periodontal status. In addition, pregnant and lactating women were excluded from the study.
Armamentarium
Instruments for collection of saliva included pre-sterilized containers, distilled water, glass funnel and icebox/refrigerator. Types of equipment for biochemical estimation included UV spectrophotometer, centrifuge, automated micropipettes, water bath, test tubes and test tube holder. Estimation of TSA was done using sialic acid kit containing chemicals which were of high quality of 5% perchloric acid, Ehrlich’s reagent, stock standard solution (100 mg %) and double distilled water (100 ml) (Fig. 1).
Fig. 1.

Showing UV spectrophotometer, pre-sterilized container with saliva samples, centrifugation machine, centrifuge, automated micropipettes and pink-coloured solution
Saliva Collection
Two millilitres of unstimulated salivary sample was collected 2 h after the consumption of food between 10 am and 12 noon to minimize diurnal variation. The subjects were asked to refrain from alcohol and smoking for 12 h before the sample collection. Moreover, the subjects were instructed to rinse the mouth with distilled water thoroughly to remove any food debris, and then, after 10 min, they were asked to spit pooled saliva in a pre-sterilized container. The saliva samples were then carried in an ice carrier box and transferred to the laboratory for biochemical analysis.
Procedure
The test sample of 0.1 ml was mixed with 2 ml of 5% perchloric acid, and test tubes were incubated at 100 °C for 5 min, cooled down under running tap water and centrifuged at 2500 rpm ×g for 4 min. Ehrlich’s reagent (0.2 ml) was added to 1.0 ml of clear supernatant solution that was obtained, and the solution was heated for 15 min at 100 °C and then cooled. To this cooled mixture, 1 ml of normal saline was added to obtain a pink-coloured solution. The optical density (OD) of the pink-coloured solution was measured at 525 nm against reagent blank in the spectrophotometer.
Estimation of Total Sialic Acid
TSA levels were estimated using the UV spectrophotometer (GENESYS 10S UV–VIS). Estimation was based on the reaction of sialic acid with Ehrlich’s reagent to form a pink-coloured solution. The absorbance (optical density) of the pink-coloured complex was measured at 525 nm. Using Beer’s law [12], the obtained absorbance (optical density) value was converted into microlitre and later into mg/dl (Table 1).
Table 1.
Total sialic acid (TSA) levels in oral squamous cell carcinoma, oral potentially malignant disorders and healthy controls (in mg/100 ml)
| Group I (OSCC) | Histopathological grading | Group II (OPMDs) | Group III (healthy controls) | |
|---|---|---|---|---|
| 570 | WDSCC | 215 | Leukoplakia | 32 |
| 524 | MDSCC | 239 | Leukoplakia | 24 |
| 464 | MDSCC | 184 | Leukoplakia | 20 |
| 510 | PDSCC | 265 | Leukoplakia | 57 |
| 324 | WDSCC | 168 | OSMF | 52 |
| 591 | WDSCC | 295 | Leukoplakia | 11 |
| 557 | WDSCC | 215 | Leukoplakia | 1 |
| 339 | PDSCC | 73 | OSMF | 5 |
| 645 | MDSCC | 274 | OSMF | 21 |
| 652 | WDSCC | 184 | Leukoplakia | 23 |
| 532 | MDSCC | 113 | Leukoplakia | 24 |
| 667 | WDSCC | 80 | Leukoplakia | 12 |
| 710 | MDSCC | 90 | Leukoplakia | 29 |
| 585 | WDSCC | 133 | Leukoplakia | 13 |
| 501 | MDSCC | 63 | Leukoplakia | 30 |
| 492 | MDSCC | 133 | Lichen planus | 45 |
| 476 | MDSCC | 265 | OSMF | 21 |
| 544 | WDSCC | 178 | Leukoplakia | 19 |
| 652 | WDSCC | 184 | Leukoplakia | 23 |
| 532 | MDSCC | 113 | Leukoplakia | 24 |
OSMF oral submucous fibrosis, WDSCC well-differentiated squamous cell carcinoma, MDSCC moderately differentiated squamous cell carcinoma, PDSCC poorly differentiated squamous cell carcinoma
Statistical and Power Analysis
Statistical analysis of the data was performed using SPSS software v22. The sample size was calculated using power analysis at 80% power of study. Kruskal–Wallis test was conducted to find the mean sialic acid levels in all the three groups. Mann–Whitney test was conducted in order to compare the mean difference in the sialic acid levels between different combinations of the groups.
Results
The aim of the present study was to evaluate whether salivary sialic acid can be used as a reliable biomarker in the detection of OPMDs and OSCC. For this purpose, we analysed salivary TSA levels of 60 subjects and performed the Kruskal–Wallis test followed by Mann–Whitney post hoc analysis. The level of significance was fixed at P < 0.05. Salivary TSA level in OSCC was higher when compared to the level in OPMDs and healthy subjects.
Table 2 shows the values of TSA levels in saliva of the three different groups of oral cancer, precancer and healthy controls in mg/dl. The test for mean score analysis (Kruskal–Wallis test) for sialic acid levels was used to compare mean scores of more than two groups. The table displays the descriptive statistics of the sample size, mean, standard deviation, min and max values of sialic acid levels. It was found that OSCC (545.45 ± 100.04) group showed much higher TSA levels when compared to the TSA levels in OPMDs (169.80 ± 66.43) and healthy subjects (25.45 ± 16.07) and was significantly different from each other at P < 0.01 (Table 2).
Table 2.
Demonstrates mean sialic acid levels in all the three groups using Kruskal–Wallis test
| Groups | N | Mean | SD | Min | Max | P value |
|---|---|---|---|---|---|---|
| Healthy subjects | 20 | 25.45 | 16.07 | 1 | 57 | < 0.001* |
| OPMDs | 20 | 169.80 | 66.43 | 63 | 274 | < 0.001* |
| OSCC | 20 | 545.45 | 100.04 | 324 | 710 | < 0.001* |
* indicates that the study is significant
Table 3 demonstrates the comparison of mean sialic acid levels (mg/dl) between different grades of OSCC. The test results showed that the mean sialic acid level in well-differentiated OSCC group was 586.18 ± 50.72, 542.27 ± 95.29 in moderately differentiated cases and 331.50 ± 10.61 in poorly differentiated OSCC cases. There was a significant difference in the mean sialic acid levels between different grades of OSCC at P < 0.001 (Table 3).
Table 3.
Comparison of mean sialic acid (mg/dl) levels between different grades of OSCC cases using Kruskal–Wallis test
| Groups | N | Mean | SD | Min | Max | P value |
|---|---|---|---|---|---|---|
| Well-differentiated OSCC | 11 | 586.18 | 50.72 | 524 | 667 | 0.02* |
| Moderately differentiated OSCC | 7 | 542.57 | 95.29 | 464 | 710 | 0.02* |
| Poorly differentiated OSCC | 2 | 331.50 | 10.61 | 324 | 339 | 0.02* |
* indicates that the study is significant
Table 4 demonstrates the mean difference in the sialic acid levels between different combinations of the groups. Based on the above results, it is found that the OSCC group shows significantly highest concentration as compared to normal and OPMD groups at P < 0.001. Similarly, the precancer group showed a significant difference as compared to the healthy group at P < 0.001 (Table 4).
Table 4.
Multiple comparison of mean difference in total sialic acid (mg/dl) between groups using Mann–Whitney post hoc test
| (I) Group | (J) Group | Mean Diff. (I–J) | 95% CI of the diff | P value | |
|---|---|---|---|---|---|
| Lower | Upper | ||||
| Healthy subjects | OPMDs | − 144.35 | − 197.58 | − 91.12 | < 0.001* |
| OSCC | − 520.00 | − 573.23 | − 466.77 | < 0.001* | |
| OPMDs | OSCC | − 375.65 | − 428.88 | − 322.42 | < 0.001* |
* indicates that the study is significant
The ROC curve obtained by plotting TSA values of the healthy and OPMDs groups showed that the area under the curve (AUC) for sialic acid is 1.00 with SE of 0.000 at CI ranging from 0.912 to 1.000 with P < 0.0001. AUC measures the accuracy of the ROC curve. Sialic acid levels showed both sensitivity and specificity of 100%.
The ROC curve obtained by plotting TSA values of the healthy and OSCC groups showed that the area under the curve (AUC) for sialic acid is 1.00 with SE of 0.000 at CI ranging from 0.912 to 1.000 with p < 0.0001. Sialic acid levels showed both sensitivity and specificity of 100%.
Figure 2 shows the ROC curve obtained by plotting TSA values for OPMDs and OSCC groups. (ROC is a plot of the true positive rate against the false positive rate for the different possible cut points of a diagnostic test.) The area under the curve in Fig. 2 for sialic acid is 1.00 with SE of 0.000 at CI ranging from 0.912 to 1.000 with P < 0.0001. The sialic acid showed both sensitivity and specificity of 100%.
Fig. 2.
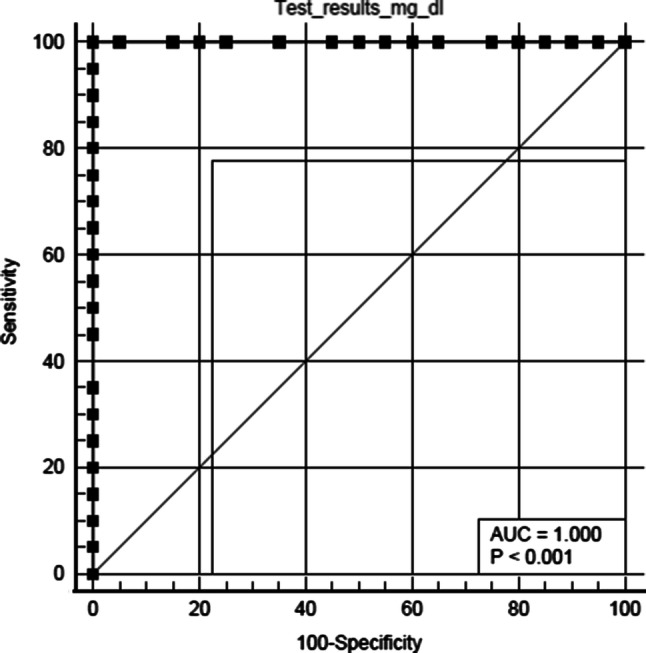
Graph showing ROC curve for OSCC and OPMDs groups
According to Youden index J criteria, the study furthermore gave a cut-off value of sialic acid levels in the healthy group as 57 mg/dl and in OPMDs group as 274 mg/dl. Any value greater than 57 mg/dl was considered as a suspected case of OPMDs; similarly, any value > 275 mg/dl was considered to be suspected case of OSCC.
Discussion
The surfaces of all vertebrate cells have a dense and complex array of sugar chains, which are mostly attached to proteins and lipids. Sialic acid is one such sugar unit that is attached to glycoprotein and glycolipid. The ubiquitous distribution and location of sialic acid can mediate or modulate a wide variety of physiological and pathological processes.
The present study has highlighted the high expression of TSA on the outer surface of the structural components of the cell membrane, suggesting that sialic acid has a role in stabilizing the molecule and membranes. Alteration in this structural component showed that there is a neoplastic transformation of the cells. With reference to healthy subjects, this study showed a significant increase in salivary TSA in OSCC and a moderate increase in OPMDs.
The cut-off value of salivary TSA in OPMDs group is 274 mg/dl. Elevation of glycoprotein constituents (value > 275 mg/dl) in patients with OPMDs could be an indication of early biochemical changes in saliva denoting the malignant transformation of the cell, thus helping in diagnosing cancer at the earliest and further reducing the morbidity and mortality rate of OSCC.
In addition, our study showed that there is a significant loss of adhesion between the cell components in well-differentiated squamous cell carcinoma compared to moderately differentiated and poorly differentiated ones. The TSA level was significantly increased in well-differentiated squamous cell carcinoma (586.18 ± 50.72) compared to moderately differentiated (542.27 ± 95.29) and poorly differentiated OSCC (331.50 ± 10.61). These dysplastic changes lead to an increase in shedding of malignant cells into the body fluid. This indicates that salivary TSA assesses not only the spread but also the invasiveness of OSCC.
Saliva being in intimate contact with the lesion suggests a potential utility of salivary sialic acid as a non-invasive diagnostic parameter. Moreover, there is a growing appreciation that it can reflect the entire spectrum of the normal and diseased state. Saliva can be easily collected over blood and therefore does not require a trained personnel in saliva sample collection, processing and storage; other reasons are it is cost-effective and decreases dramatically the anxiety and discomfort. Thus, the availability of repeated samples encourages the research of salivary sialic acid for OSCC detection as well as for monitoring its progression. Baxi et al. [13] reported a higher level of serum TSA and lipid-bound sialic acid in OSCC and precancerous cells when compared with controls. In contrast, in our study we used saliva as a non-invasive method for the detection of TSA levels in OPMDs and OSCC.
The oral cavity is commonly subjected to inflammation from a variety of causes such as infection, dental plaque and trauma. Ideally, to consider as the best biomarker requires high sensitivity and specificity. In order to obtain high sensitivity and specificity value and to avoid false positive rates, excluding this inflammatory condition is of utmost importance. In our study, we have excluded all inflammatory conditions including poor periodontal status. The ROC curve obtained by plotting TSA values of all the three groups showed the area under the curve (AUC) for sialic acid is 1.00 with SE of 0.000 at CI ranging from 0.912 to 1.000 with P < 0.0001. In our study, sialic acid levels showed both sensitivity and specificity of 100% between all the three groups. Similar study conducted by Jacob et al. [1] reported firstly an increase in the level of salivary TSA in oral cancer and precancerous group secondly, there was an increase in salivary TSA levels as the histopathological grade progressed. However, the sensitivity and specificity values of the sialic acid were not determined.
Mollashahi et al. [14] reported that healthy subjects with the history of pan consumption (smokeless tobacco) showed an increase in salivary free sialic acid (23.21 ± 18.98 mg/l), salivary TSA (39.57 ± 26.58 mg/l) and total protein levels (0.77 ± 0.81 mg/ml). In contrast, the results of this study were statistically insignificant. Kurtul [15] also reported that the salivary TSA concentrations were higher in the smokers and madras power users (smokeless tobacco) compared to those of controls. The TSA levels were within the range of 62–64 mg/dl. However, the present study showed a significant increase in mean salivary TSA level in subjects with OSCC (545.45 mg/dl) and in OPMDs (169.80 mg/dl). In addition, all the subjects in the study were asked to refrain from alcohol and smoking 12 h prior to the collection of salivary samples in order to avoid false-positive reactions. This indicates that though there is an association between the increase in salivary TSA levels of subjects with a history of smokeless and smoking tobacco consumption. The evident increase in salivary TSA levels could be possibly due to neoplastic changes in the structural component of the cell membrane.
Rathod et al. [16] reported an increase in salivary TSA levels with the severity of the periodontal disease. The study showed that in the chronic gingivitis group, the mean salivary TSA level was 68.23 mg/dl ± 2.71, and in the chronic periodontitis group, the mean salivary TSA was 81.33 mg/dl ± 3.94. Though there is a correlation of salivary sialic acid levels with periodontal health, our study showed the mean sialic acid levels in subjects with OPMDs as 169.80 mg/dl and in OSCC as 545.45 mg/dl. Moreover, the current study has excluded all the inflammatory conditions including poor periodontal status. This clearly indicates that this significant increase in salivary TSA levels could be possibly due to the dysplastic change.
The current study suggests that salivary TSA can be used as a promising and efficient marker for the detection of OSCC and OPMDs because firstly, it has a direct contact with the lesion; secondly, it showed the malignant transformation of the cell; and thirdly, it aids in detecting cancer at the early stage. However, studies with larger sample size could possibly validate the utility of sialic acid as a reliable biomarker in clinical entity.
Conclusion
In conclusion, our study indicates that glycoprotein metabolism is significantly altered in the saliva of patients, with both OSCC and OPMDs. The elevated sialic acid level in OSCC and OPMDs indicates its role as a tumour marker. The anatomical proximity of saliva with these malignant as well as potentially malignant lesions makes salivary sialic acid an ideal choice as a non-invasive diagnostic tool. Further, non-invasive diagnostic methods like salivary examination have the advantage of being used in screening and monitoring a larger population. The method used in the current study to detect sialic acid in saliva was comparatively easy and cost-effective. Thus, saliva study offers a bright scope in future to aid in the early detection of oral potentially malignant and malignant lesions.
Acknowledgements
All the authors have viewed and agreed to the submission.
Funding
None.
Compliance with Ethical Standards
Conflict of interest
The authors declare that we have no conflict of interest.
Ethical Approval
Ethical clearance was obtained from the Institutional Ethical Committee on 14 November 2018 with Ref No: 240/2018-19.
Informed Consent
Written informed consent was obtained from each of the patients.
Footnotes
Publisher's Note
Springer Nature remains neutral with regard to jurisdictional claims in published maps and institutional affiliations.
Contributor Information
Diana Daniel, Email: drdianadaniel@gmail.com.
Jerin Jose, Email: jessicajose19@gmail.com.
A. Harish Kumar, Email: harishsuraksha@gmail.com
References
- 1.Jacob TV, Ramesh M, Murali S, Ramesh K, Sanjay PR, Abraham P. A non-invasive study to estimate and compare salivary sialic acid level as tumor marker in patients with precancer and oral cancer. J Cancer Res Ther. 2016;12:634–639. doi: 10.4103/0973-1482.148697. [DOI] [PubMed] [Google Scholar]
- 2.Rajpura KB, Patel PS, Chawda JG, Shah RM. Clinical significance of total and lipid bound sialic acid levels in oral pre-cancerous conditions and oral cancer. J Oral Pathol Med. 2005;34:263–267. doi: 10.1111/j.1600-0714.2004.00210.x. [DOI] [PubMed] [Google Scholar]
- 3.Sanjay PR, Hallikeri K, Shivashankara AR. Evaluation of salivary sialic acid, total protein and total sugar in oral cancer: a preliminary report. Indian J Dent Res. 2008;19:288–291. doi: 10.4103/0970-9290.44529. [DOI] [PubMed] [Google Scholar]
- 4.Chan DW, Schwartz MK. Tumor markers. In: Diamandis EP, Fritsche HA, Lilja H, Chan DW, Schwartz MK, editors. Physiology, pathobiology, technology, and clinical applications. Tumor markers: introduction and general principles. Washington: AACC Press; 2002. pp. 9–17. [Google Scholar]
- 5.Segal A, Wong DT. Salivary diagnostics: enhancing disease detection and making medicine better. Eur J Dent Educ. 2008;12:22–29. doi: 10.1111/j.1600-0579.2007.00477.x. [DOI] [PMC free article] [PubMed] [Google Scholar]
- 6.Cohen RE, Levine MJ. Salivary glycoproteins. In: Tenovuo JO, editor. Human saliva: clinical, chemical and microbiology. Boca Raton: CRC Press; 2000. pp. 101–130. [Google Scholar]
- 7.Shah MH, Telang SD, Shah PM, Patel PS. Tissue and serum alpha 2-3- and alpha 2-6-linkage specific sialylation changes in oral carcinogenesis. Glycoconj J. 2008;25:279–290. doi: 10.1007/s10719-007-9086-4. [DOI] [PubMed] [Google Scholar]
- 8.Shah MH, Telang SD, Raval GN, Shah PM, Patel PS. Serum fucosylation changes in oral cancer and oral precancerous conditions: alpha-l-fucosidase as a marker. Cancer. 2008;113:336–346. doi: 10.1002/cncr.23556. [DOI] [PubMed] [Google Scholar]
- 9.Chaudhary V, Pradeep GL, Prakash N, Mahajan AM. Estimation of salivary sialic acid in oral premalignancy and oral squamous cell carcinoma. Contemp Clin Dent. 2016;7:451–456. doi: 10.4103/0976-237X.194108. [DOI] [PMC free article] [PubMed] [Google Scholar]
- 10.Achalli S, Madi M, Babu SG, Shetty SR, Kumari S, Bhat S. Sialic acid as a biomarker of oral potentially malignant disorders and oral cancer. Indian J Dent Res. 2017;28:395–399. doi: 10.4103/ijdr.IJDR_632_16. [DOI] [PubMed] [Google Scholar]
- 11.Malati T. Tumour markers: an overview. Indian J Clin Biochem. 2007;22:17–31. doi: 10.1007/BF02913308. [DOI] [PMC free article] [PubMed] [Google Scholar]
- 12.Mayerhofer TG, Popp J. Beer’s law—why absorbance depends (almost) linearly on concentration. ChemPhysChem. 2018 doi: 10.1002/cphc.201801073. [DOI] [PubMed] [Google Scholar]
- 13.Baxi BR, Patel PS, Adhvaryu SG, Dayal PK. Usefulness of serum glycoconjugates in precancerous and cancerous diseases of the oral cavity. Cancer. 1991;67:135–140. doi: 10.1002/1097-0142(19910101)67:1<135::AID-CNCR2820670124>3.0.CO;2-6. [DOI] [PubMed] [Google Scholar]
- 14.Farhad ML, Honarmand M, Nakhaee A, Mollashahi G. Salivary sialic acid levels in smokeless tobacco users. Int J High Risk Behav Addict. 2016 doi: 10.5812/ijhrba.27969. [DOI] [PMC free article] [PubMed] [Google Scholar]
- 15.Kurtul N, Gökpınar E. Salivary lipid peroxidation and total sialic acid levels in smokers and smokeless tobacco users as Maraş powder. Mediat Inflamm. 2012 doi: 10.1155/2012/619293. [DOI] [PMC free article] [PubMed] [Google Scholar]
- 16.Rathod SR, Khan F, Kolte AP, Gupta M. Estimation of salivary and serum total sialic acid levels in periodontal health and disease. J Clin Diagn Res. 2014 doi: 10.7860/JCDR/2014/9615.4800. [DOI] [PMC free article] [PubMed] [Google Scholar]