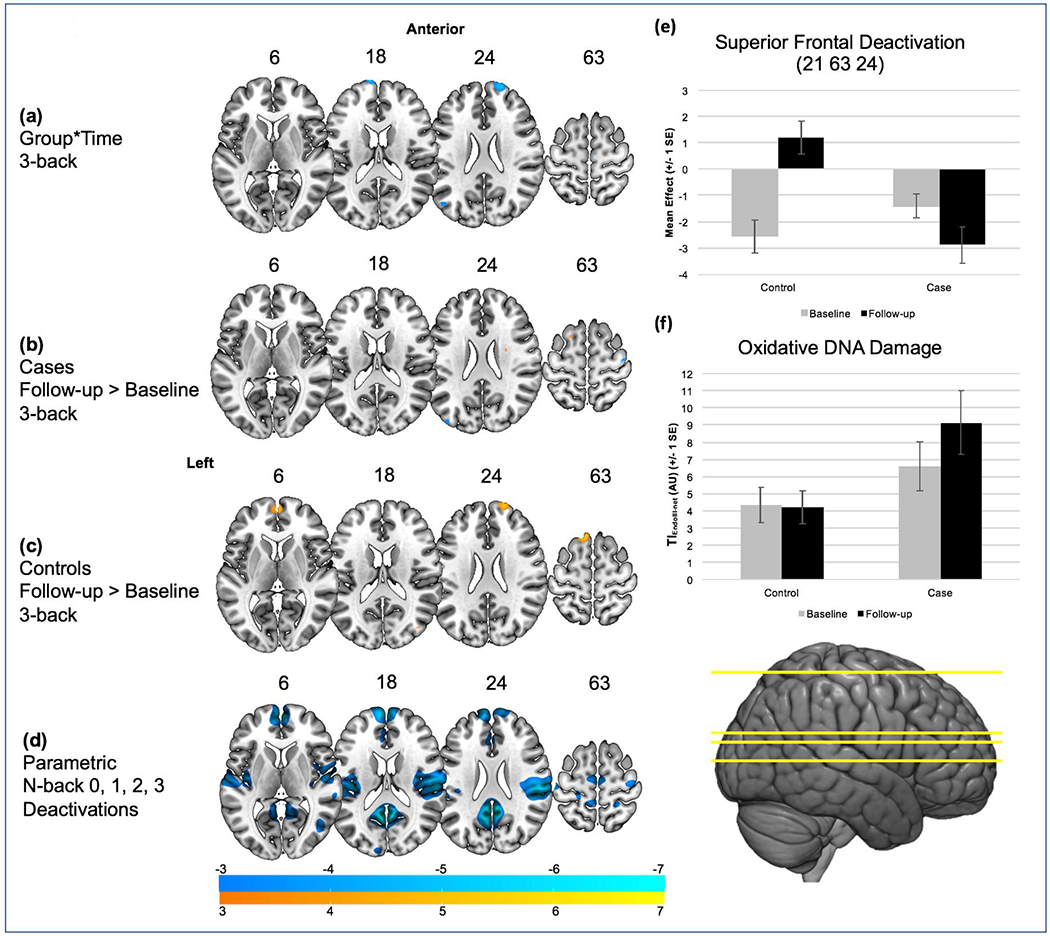
Figure 1.

The number above each slice indicates the MNI z coordinate. Warm colors indicate increased activation while cool colors indicate decreased activation for the breast cancer versus healthy control group. a) Group x Time interaction in superior medial frontal gyrus and superior frontal gyrus for the 3-back condition; b) for cases, no significant change in recruitment for the 3-back condition; c) for controls, significantly decreased task induced deactivation in medial and superior frontal gyrus at follow-up compared to baseline for the 3-back condition; d) parametric weighting of 0, 1, 2, 3 back and associated task induced deactivations to contextualize changes in task-induced deactivation with increasing working memory load from 0- to 3-back conditions; e) BOLD signal magnitudes for cases and controls from baseline to follow-up in superior frontal gyrus (21 63 24); f) Endonuclease III Treated Tail Intensity (TIEndoIII) minus endogenous damage for cases and controls from baseline to follow-up; AU, arbitrary units.
