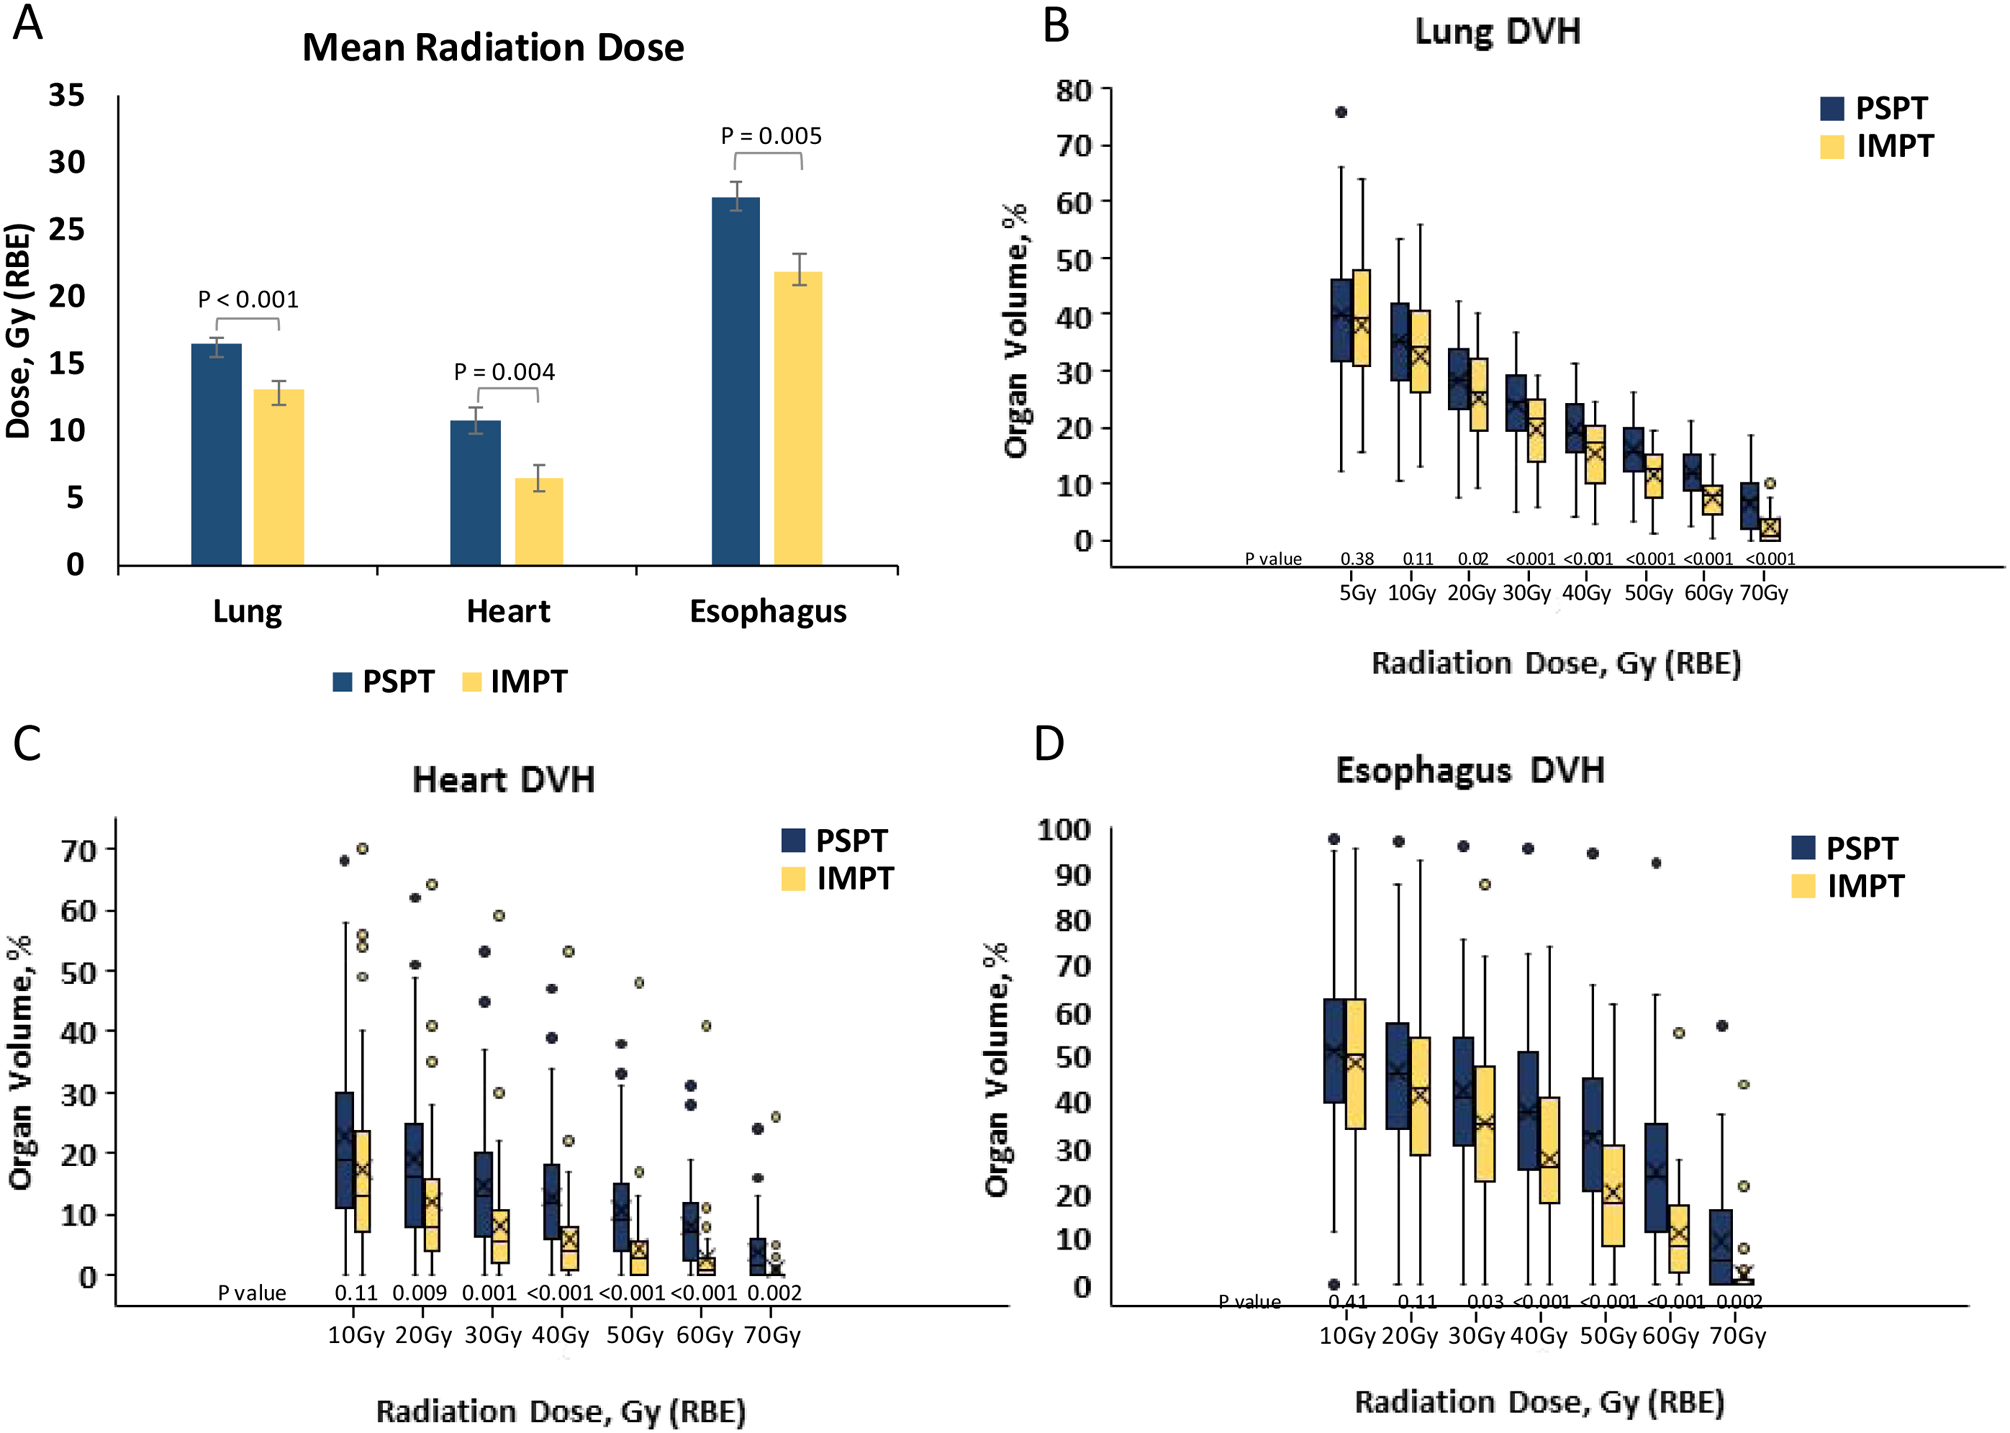
Figure 2. Dosimetric analysis.

Mean radiation dose to critical organs at risk from passive scattering proton therapy (PSPT) and intensity-modulated proton therapy (IMPT) (A). Box plots of dose-volume histogram (DVH) data on radiation dose and organ volume for the lung (B), heart (C) and esophagus (D). Whiskers indicate 1.5 times the interquartile range above and below the median; dots represent outliers. P < 0.05 was the threshold for statistical significance.
