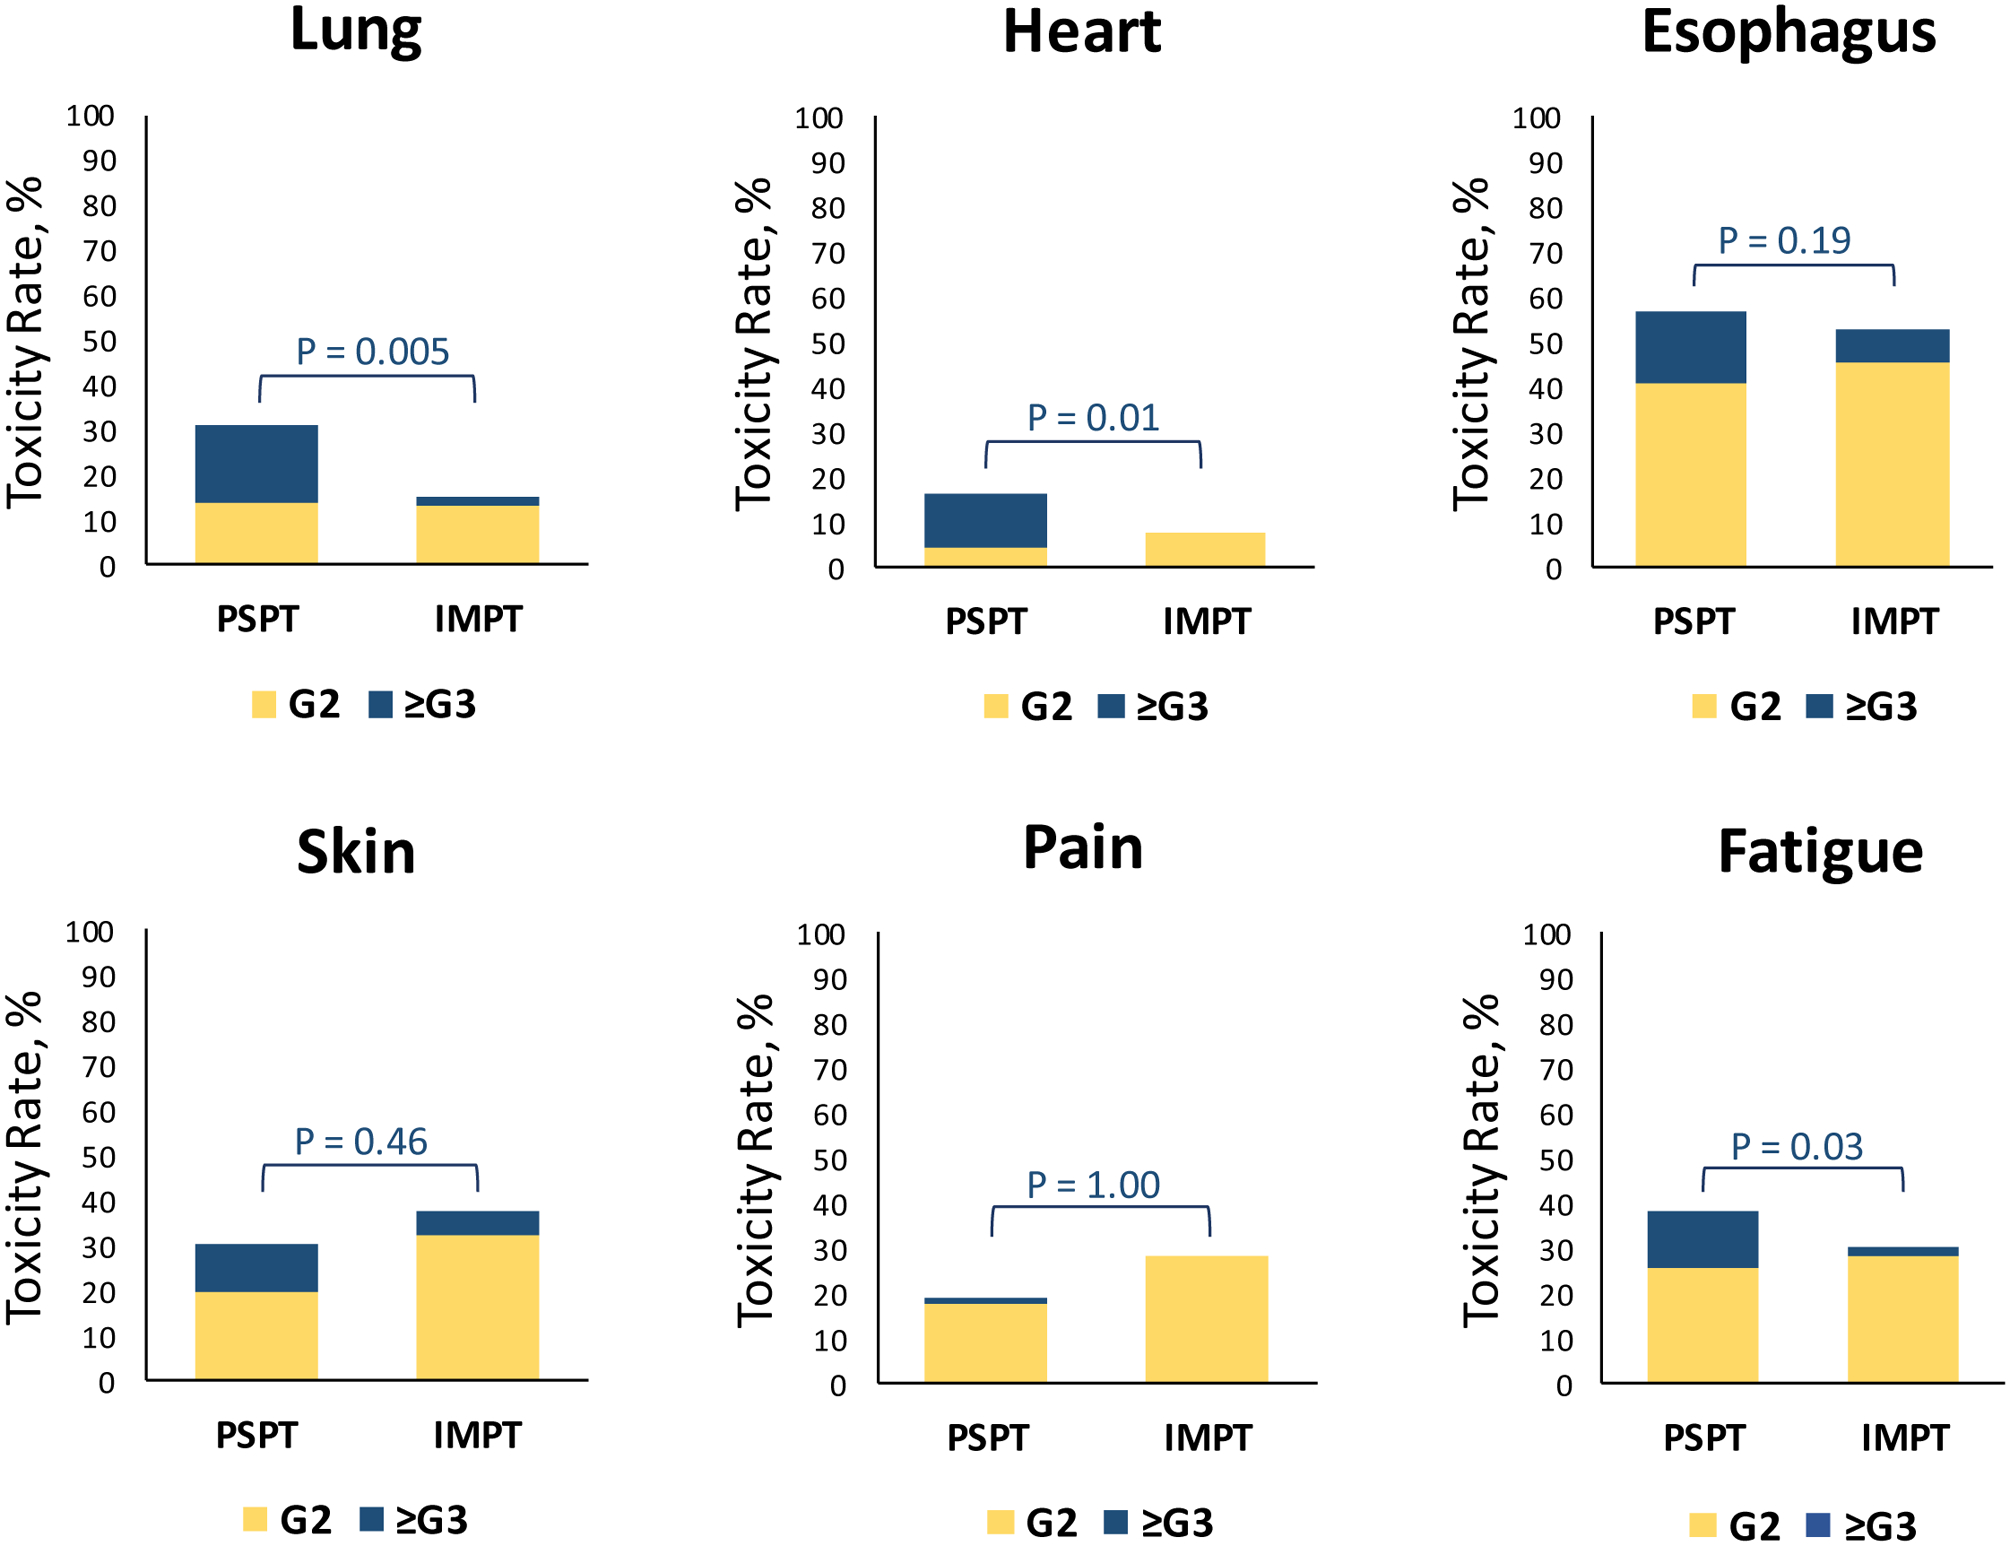
Figure 3. Toxicity profiles.

Rates of grade 2 (yellow) and grade ≥3 (blue) toxicity to critical organs at risk for patients treated with passive scattering proton therapy (PSPT) or intensity-modulated proton therapy (IMPT). The P values above each set of bars correspond to differences in the rates of grade ≥3 toxicity only. P < 0.05 was the threshold for statistical significance.
