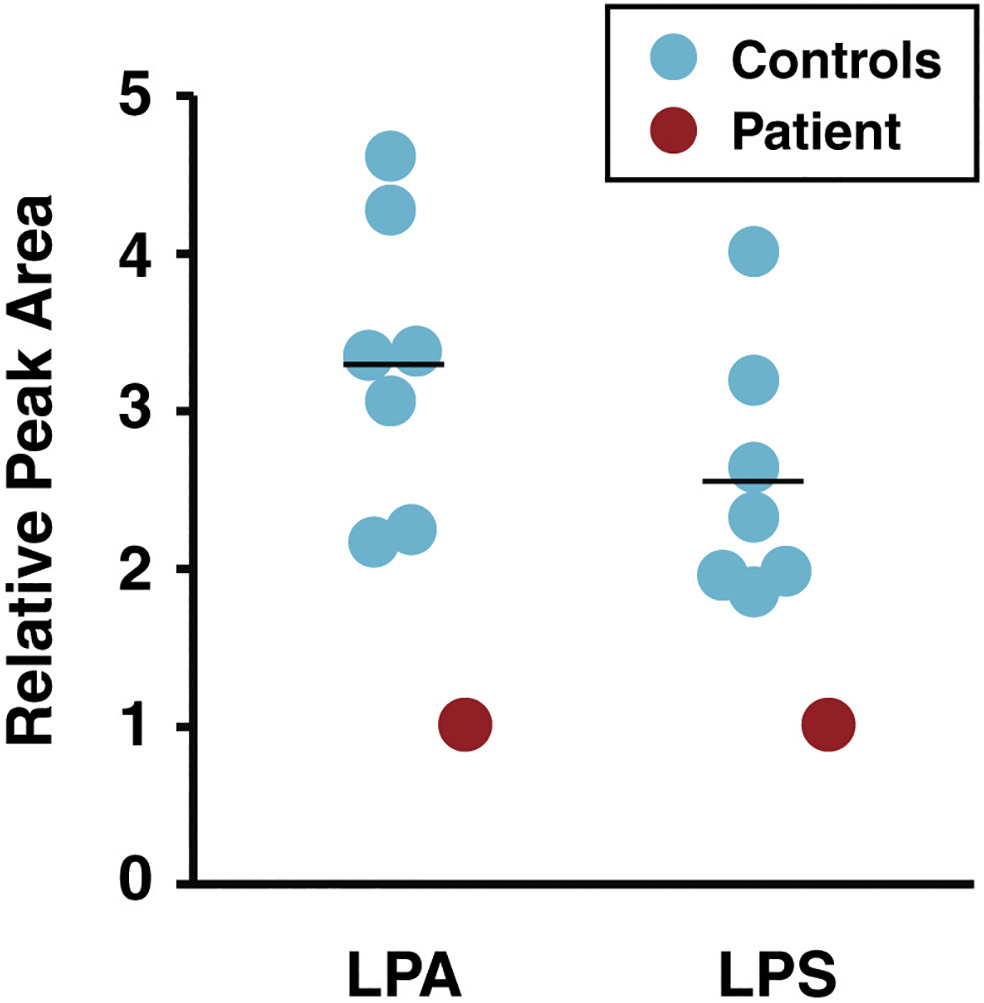
Figure 7. Relative abundance of lipids in DPM2-mutant and control fibroblasts.

Relative peak areas reflecting abundance of lysophosphatidic acid (LPA) and lysophosphatidylserine (LPS) from lipidomic analysis of fibroblasts from controls (blue) and the DPM2 patient (red) are shown as circles. The horizontal line indicates average values in each group.
