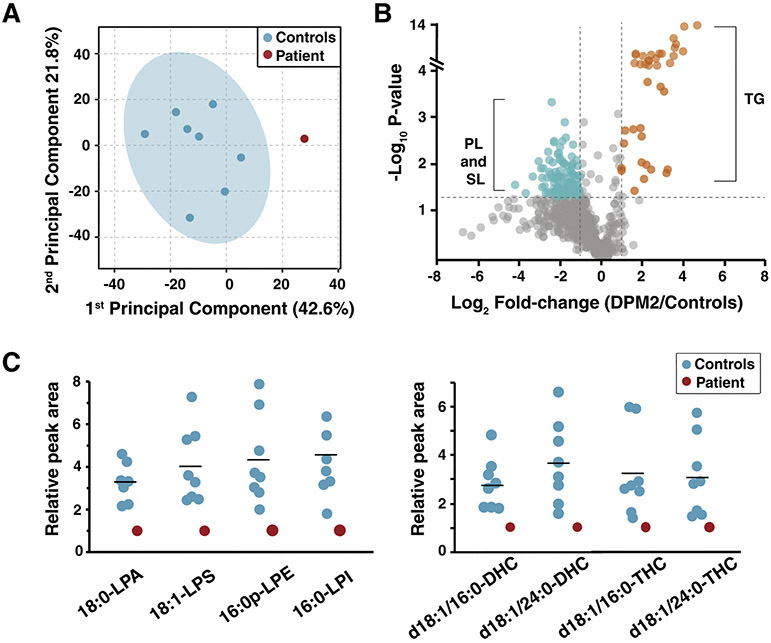
Figure 9. Alterations in lipid subspecies from multiple classes of lipids in the DPM2 patient.
(A) Principal component analysis on untargeted lipidomics of control fibroblasts (blue) and DPM2 patient-derived fibroblasts (red) is illustrated. (B) Changes of individual lipid subspecies in the DPM2 patient with reference of controls is shown as a volcano plot. Each circle represents fibroblast lipid species analyzed in the study. Lipid species that were increased significantly in the DPM2 patient (fold-change>2 and p<0.05) are shown in orange while those that were decreased (are shown in blue. The lipid species that were not significantly altered are depicted in gray. While lipid species that were increased in the patient were mainly triglyceride (TG) subspecies, those that were decreased were mainly phospholipid (PL) and sphingolipid (SL) subspecies. (C) Relative peak areas of high abundance phospholipids (left panel) and sphingolipids (right panel) subspecies that were decreased in the DPM2 patient (red) compared to controls (blue) are shown. The horizontal line indicates average values in each group.
*Abbreviations: DHC: dihexosylceramide, LPA: lysophosphatidic acid; LPS: lysophosphatidylserine; LPE: lysophosphatidylethanolamine; LPI: lysophosphatidylinositol; PL: phospholipid; SL: sphingolipid; TG: triglycerol; THC: trihexosylceramide.

